Immigrants from Jamaica vs Guamanian/Chamorro Bachelor's Degree
COMPARE
Immigrants from Jamaica
Guamanian/Chamorro
Bachelor's Degree
Bachelor's Degree Comparison
Immigrants from Jamaica
Guamanians/Chamorros
32.9%
BACHELOR'S DEGREE
0.5/ 100
METRIC RATING
262nd/ 347
METRIC RANK
34.6%
BACHELOR'S DEGREE
3.0/ 100
METRIC RATING
234th/ 347
METRIC RANK
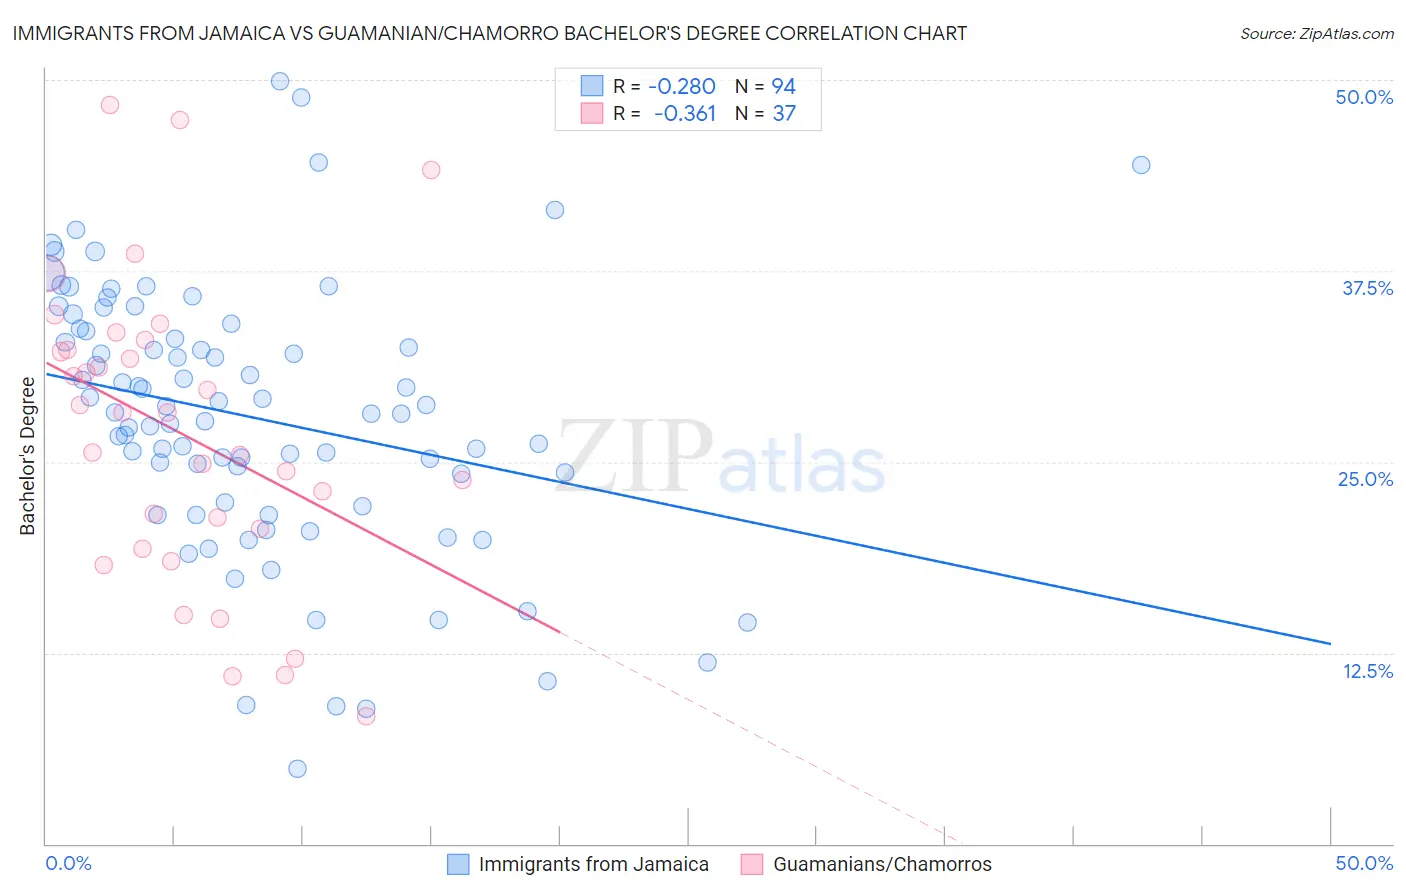
Immigrants from Jamaica vs Guamanian/Chamorro Bachelor's Degree Correlation Chart
The statistical analysis conducted on geographies consisting of 301,812,649 people shows a weak negative correlation between the proportion of Immigrants from Jamaica and percentage of population with at least bachelor's degree education in the United States with a correlation coefficient (R) of -0.280 and weighted average of 32.9%. Similarly, the statistical analysis conducted on geographies consisting of 221,963,631 people shows a mild negative correlation between the proportion of Guamanians/Chamorros and percentage of population with at least bachelor's degree education in the United States with a correlation coefficient (R) of -0.361 and weighted average of 34.6%, a difference of 5.3%.
Bachelor's Degree Correlation Summary
| Measurement | Immigrants from Jamaica | Guamanian/Chamorro |
| Minimum | 4.9% | 8.3% |
| Maximum | 50.0% | 48.4% |
| Range | 45.0% | 40.0% |
| Mean | 27.9% | 26.9% |
| Median | 28.2% | 28.2% |
| Interquartile 25% (IQ1) | 22.3% | 20.0% |
| Interquartile 75% (IQ3) | 33.6% | 32.6% |
| Interquartile Range (IQR) | 11.2% | 12.7% |
| Standard Deviation (Sample) | 8.7% | 9.8% |
| Standard Deviation (Population) | 8.7% | 9.7% |
Similar Demographics by Bachelor's Degree
Demographics Similar to Immigrants from Jamaica by Bachelor's Degree
In terms of bachelor's degree, the demographic groups most similar to Immigrants from Jamaica are African (32.9%, a difference of 0.0%), Malaysian (32.9%, a difference of 0.090%), Belizean (32.8%, a difference of 0.29%), Osage (33.0%, a difference of 0.45%), and French American Indian (33.1%, a difference of 0.50%).
| Demographics | Rating | Rank | Bachelor's Degree |
| Iroquois | 0.7 /100 | #255 | Tragic 33.2% |
| Nicaraguans | 0.6 /100 | #256 | Tragic 33.1% |
| Spanish Americans | 0.6 /100 | #257 | Tragic 33.1% |
| French American Indians | 0.6 /100 | #258 | Tragic 33.1% |
| Osage | 0.5 /100 | #259 | Tragic 33.0% |
| Malaysians | 0.5 /100 | #260 | Tragic 32.9% |
| Africans | 0.5 /100 | #261 | Tragic 32.9% |
| Immigrants | Jamaica | 0.5 /100 | #262 | Tragic 32.9% |
| Belizeans | 0.4 /100 | #263 | Tragic 32.8% |
| Central American Indians | 0.3 /100 | #264 | Tragic 32.5% |
| Bahamians | 0.3 /100 | #265 | Tragic 32.5% |
| Immigrants | Dominica | 0.3 /100 | #266 | Tragic 32.5% |
| Cubans | 0.3 /100 | #267 | Tragic 32.5% |
| Immigrants | Portugal | 0.2 /100 | #268 | Tragic 32.2% |
| Immigrants | Belize | 0.2 /100 | #269 | Tragic 32.1% |
Demographics Similar to Guamanians/Chamorros by Bachelor's Degree
In terms of bachelor's degree, the demographic groups most similar to Guamanians/Chamorros are Immigrants from West Indies (34.6%, a difference of 0.090%), Liberian (34.6%, a difference of 0.20%), Immigrants from Ecuador (34.7%, a difference of 0.22%), Tlingit-Haida (34.6%, a difference of 0.24%), and Hmong (34.8%, a difference of 0.32%).
| Demographics | Rating | Rank | Bachelor's Degree |
| Ecuadorians | 6.6 /100 | #227 | Tragic 35.4% |
| Immigrants | Trinidad and Tobago | 6.0 /100 | #228 | Tragic 35.3% |
| Whites/Caucasians | 5.9 /100 | #229 | Tragic 35.3% |
| Immigrants | Grenada | 4.3 /100 | #230 | Tragic 35.0% |
| Immigrants | St. Vincent and the Grenadines | 4.3 /100 | #231 | Tragic 35.0% |
| Hmong | 3.4 /100 | #232 | Tragic 34.8% |
| Immigrants | Ecuador | 3.3 /100 | #233 | Tragic 34.7% |
| Guamanians/Chamorros | 3.0 /100 | #234 | Tragic 34.6% |
| Immigrants | West Indies | 2.9 /100 | #235 | Tragic 34.6% |
| Liberians | 2.8 /100 | #236 | Tragic 34.6% |
| Tlingit-Haida | 2.8 /100 | #237 | Tragic 34.6% |
| Guyanese | 2.5 /100 | #238 | Tragic 34.5% |
| British West Indians | 2.5 /100 | #239 | Tragic 34.5% |
| Tongans | 2.0 /100 | #240 | Tragic 34.3% |
| Immigrants | Cambodia | 1.9 /100 | #241 | Tragic 34.2% |