Immigrants from Italy vs Ute Doctorate Degree
COMPARE
Immigrants from Italy
Ute
Doctorate Degree
Doctorate Degree Comparison
Immigrants from Italy
Ute
2.1%
DOCTORATE DEGREE
96.9/ 100
METRIC RATING
113th/ 347
METRIC RANK
2.0%
DOCTORATE DEGREE
93.2/ 100
METRIC RATING
124th/ 347
METRIC RANK
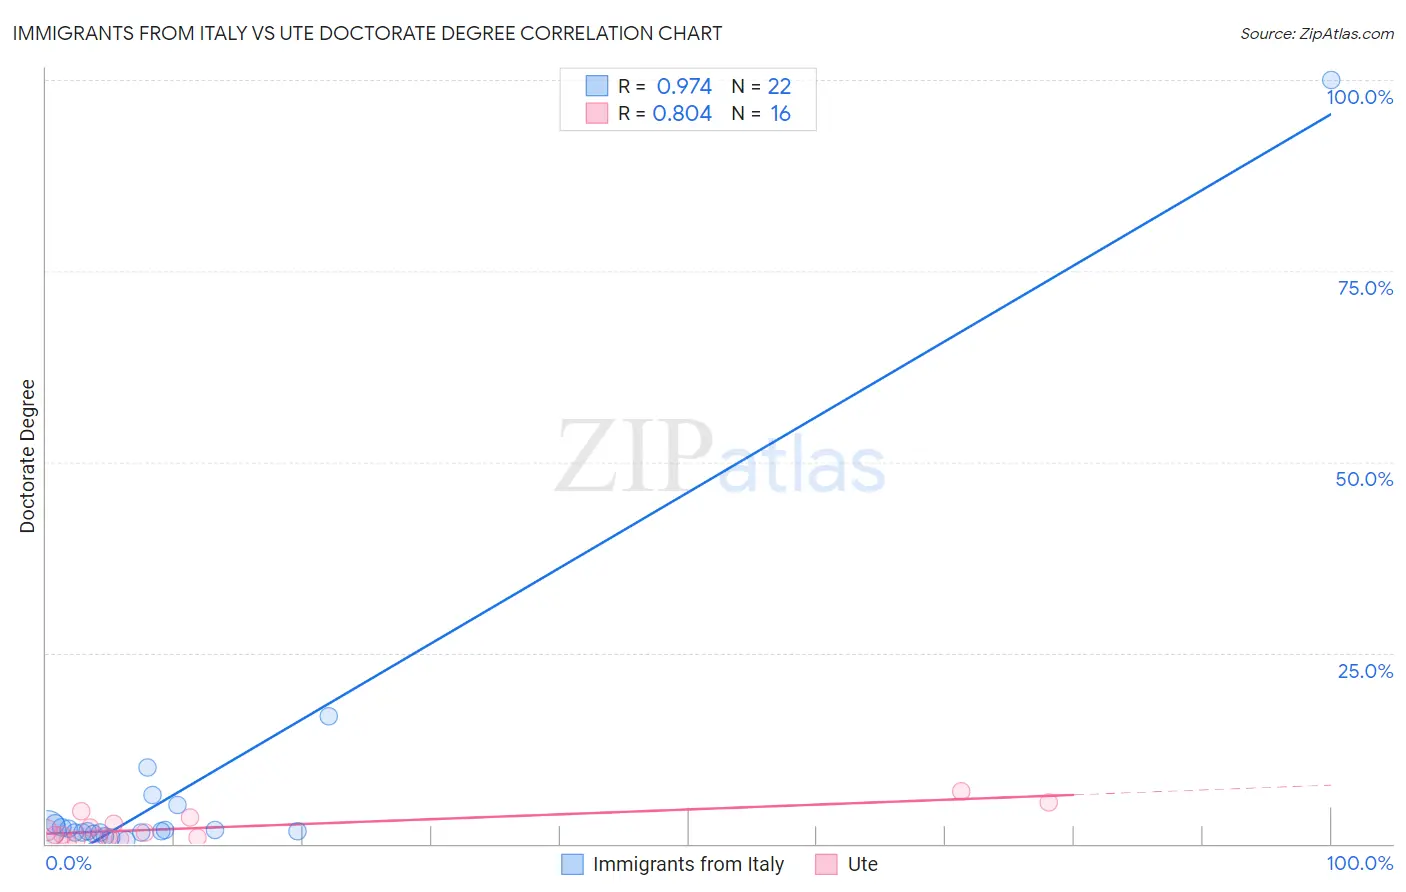
Immigrants from Italy vs Ute Doctorate Degree Correlation Chart
The statistical analysis conducted on geographies consisting of 322,534,686 people shows a perfect positive correlation between the proportion of Immigrants from Italy and percentage of population with at least doctorate degree education in the United States with a correlation coefficient (R) of 0.974 and weighted average of 2.1%. Similarly, the statistical analysis conducted on geographies consisting of 55,479,547 people shows a very strong positive correlation between the proportion of Ute and percentage of population with at least doctorate degree education in the United States with a correlation coefficient (R) of 0.804 and weighted average of 2.0%, a difference of 2.8%.
Doctorate Degree Correlation Summary
| Measurement | Immigrants from Italy | Ute |
| Minimum | 0.55% | 0.23% |
| Maximum | 100.0% | 6.9% |
| Range | 99.5% | 6.7% |
| Mean | 7.5% | 2.1% |
| Median | 1.7% | 1.3% |
| Interquartile 25% (IQ1) | 1.4% | 0.83% |
| Interquartile 75% (IQ3) | 2.6% | 3.1% |
| Interquartile Range (IQR) | 1.2% | 2.2% |
| Standard Deviation (Sample) | 21.0% | 1.9% |
| Standard Deviation (Population) | 20.5% | 1.9% |
Demographics Similar to Immigrants from Italy and Ute by Doctorate Degree
In terms of doctorate degree, the demographic groups most similar to Immigrants from Italy are Immigrants from Croatia (2.1%, a difference of 0.15%), Syrian (2.1%, a difference of 0.21%), Immigrants from Pakistan (2.1%, a difference of 0.23%), Taiwanese (2.1%, a difference of 0.23%), and Brazilian (2.1%, a difference of 0.29%). Similarly, the demographic groups most similar to Ute are Moroccan (2.0%, a difference of 0.11%), Croatian (2.0%, a difference of 0.47%), Jordanian (2.0%, a difference of 0.52%), Palestinian (2.0%, a difference of 0.56%), and Immigrants from Southern Europe (2.0%, a difference of 0.93%).
| Demographics | Rating | Rank | Doctorate Degree |
| Immigrants | Germany | 97.3 /100 | #108 | Exceptional 2.1% |
| Ukrainians | 97.2 /100 | #109 | Exceptional 2.1% |
| Brazilians | 97.2 /100 | #110 | Exceptional 2.1% |
| Immigrants | Pakistan | 97.1 /100 | #111 | Exceptional 2.1% |
| Syrians | 97.1 /100 | #112 | Exceptional 2.1% |
| Immigrants | Italy | 96.9 /100 | #113 | Exceptional 2.1% |
| Immigrants | Croatia | 96.8 /100 | #114 | Exceptional 2.1% |
| Taiwanese | 96.7 /100 | #115 | Exceptional 2.1% |
| Maltese | 96.2 /100 | #116 | Exceptional 2.1% |
| Lebanese | 96.0 /100 | #117 | Exceptional 2.1% |
| Icelanders | 96.0 /100 | #118 | Exceptional 2.1% |
| Pakistanis | 95.8 /100 | #119 | Exceptional 2.0% |
| Immigrants | Morocco | 95.5 /100 | #120 | Exceptional 2.0% |
| Immigrants | Jordan | 94.8 /100 | #121 | Exceptional 2.0% |
| Immigrants | Southern Europe | 94.7 /100 | #122 | Exceptional 2.0% |
| Croatians | 94.0 /100 | #123 | Exceptional 2.0% |
| Ute | 93.2 /100 | #124 | Exceptional 2.0% |
| Moroccans | 93.0 /100 | #125 | Exceptional 2.0% |
| Jordanians | 92.1 /100 | #126 | Exceptional 2.0% |
| Palestinians | 92.0 /100 | #127 | Exceptional 2.0% |
| Immigrants | Zaire | 91.1 /100 | #128 | Exceptional 2.0% |