Immigrants from Italy vs Immigrants from Spain 2nd Grade
COMPARE
Immigrants from Italy
Immigrants from Spain
2nd Grade
2nd Grade Comparison
Immigrants from Italy
Immigrants from Spain
97.9%
2ND GRADE
60.2/ 100
METRIC RATING
162nd/ 347
METRIC RANK
97.9%
2ND GRADE
55.4/ 100
METRIC RATING
169th/ 347
METRIC RANK
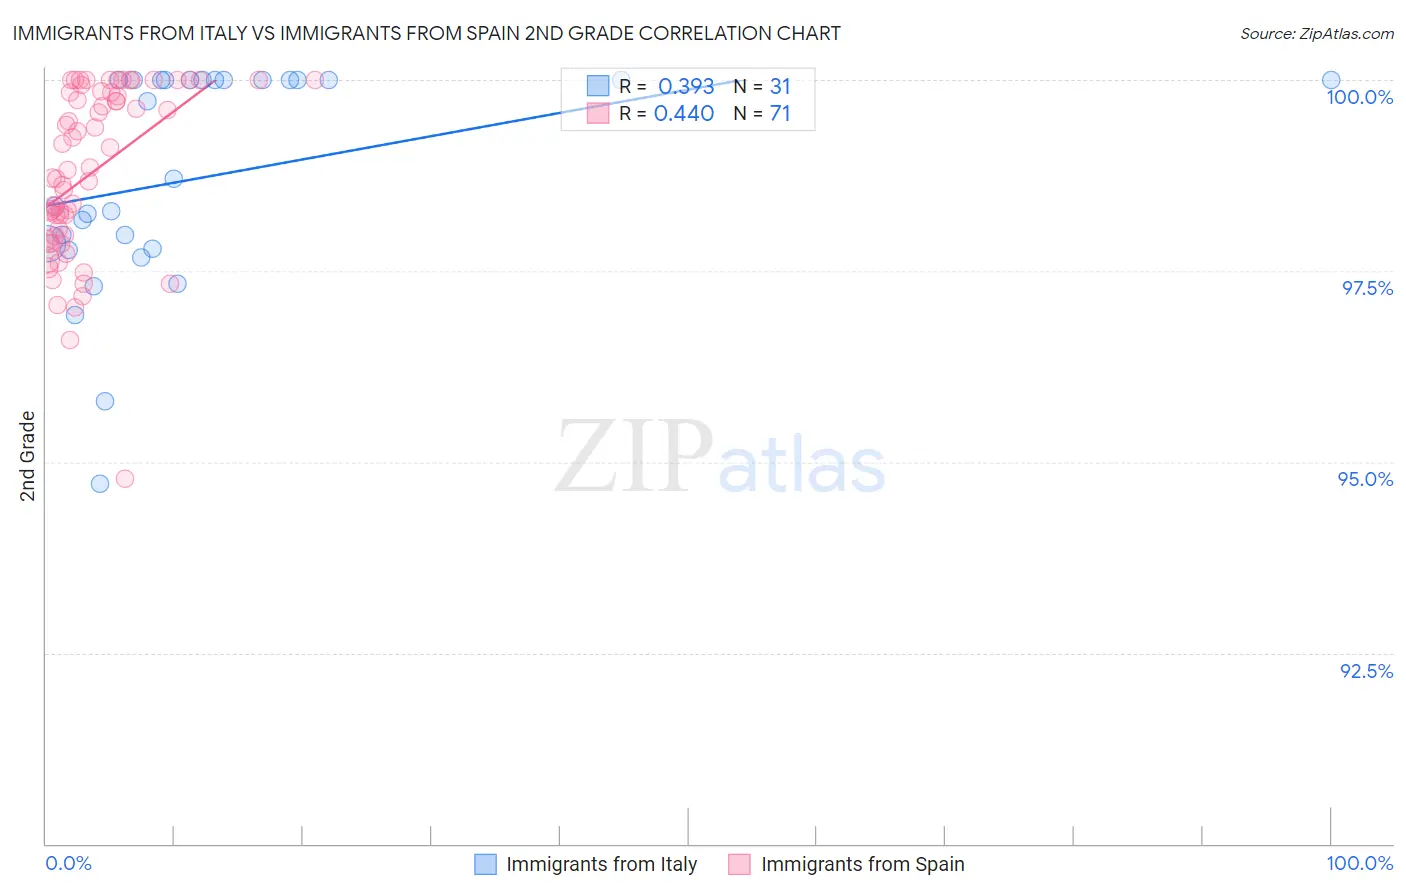
Immigrants from Italy vs Immigrants from Spain 2nd Grade Correlation Chart
The statistical analysis conducted on geographies consisting of 324,225,917 people shows a mild positive correlation between the proportion of Immigrants from Italy and percentage of population with at least 2nd grade education in the United States with a correlation coefficient (R) of 0.393 and weighted average of 97.9%. Similarly, the statistical analysis conducted on geographies consisting of 239,682,160 people shows a moderate positive correlation between the proportion of Immigrants from Spain and percentage of population with at least 2nd grade education in the United States with a correlation coefficient (R) of 0.440 and weighted average of 97.9%, a difference of 0.020%.
2nd Grade Correlation Summary
| Measurement | Immigrants from Italy | Immigrants from Spain |
| Minimum | 94.7% | 94.8% |
| Maximum | 100.0% | 100.0% |
| Range | 5.3% | 5.2% |
| Mean | 98.7% | 98.8% |
| Median | 98.7% | 98.8% |
| Interquartile 25% (IQ1) | 97.8% | 98.0% |
| Interquartile 75% (IQ3) | 100.0% | 99.8% |
| Interquartile Range (IQR) | 2.2% | 1.9% |
| Standard Deviation (Sample) | 1.4% | 1.1% |
| Standard Deviation (Population) | 1.4% | 1.1% |
Demographics Similar to Immigrants from Italy and Immigrants from Spain by 2nd Grade
In terms of 2nd grade, the demographic groups most similar to Immigrants from Italy are Immigrants from Eastern Europe (97.9%, a difference of 0.0%), Immigrants from Russia (97.9%, a difference of 0.0%), Bermudan (97.9%, a difference of 0.0%), French American Indian (97.9%, a difference of 0.010%), and Dutch West Indian (97.9%, a difference of 0.010%). Similarly, the demographic groups most similar to Immigrants from Spain are Ugandan (97.9%, a difference of 0.0%), Spanish American (97.9%, a difference of 0.0%), Immigrants from Jordan (97.9%, a difference of 0.0%), Chilean (97.9%, a difference of 0.0%), and Brazilian (97.9%, a difference of 0.0%).
| Demographics | Rating | Rank | 2nd Grade |
| French American Indians | 64.3 /100 | #155 | Good 97.9% |
| Dutch West Indians | 63.8 /100 | #156 | Good 97.9% |
| Venezuelans | 63.3 /100 | #157 | Good 97.9% |
| Immigrants | Iran | 62.8 /100 | #158 | Good 97.9% |
| Comanche | 62.8 /100 | #159 | Good 97.9% |
| Immigrants | Eastern Europe | 61.1 /100 | #160 | Good 97.9% |
| Immigrants | Russia | 60.3 /100 | #161 | Good 97.9% |
| Immigrants | Italy | 60.2 /100 | #162 | Good 97.9% |
| Bermudans | 59.4 /100 | #163 | Average 97.9% |
| Ugandans | 56.6 /100 | #164 | Average 97.9% |
| Spanish Americans | 56.4 /100 | #165 | Average 97.9% |
| Immigrants | Jordan | 56.3 /100 | #166 | Average 97.9% |
| Chileans | 56.1 /100 | #167 | Average 97.9% |
| Brazilians | 55.8 /100 | #168 | Average 97.9% |
| Immigrants | Spain | 55.4 /100 | #169 | Average 97.9% |
| Navajo | 54.3 /100 | #170 | Average 97.9% |
| Albanians | 52.8 /100 | #171 | Average 97.9% |
| Immigrants | Korea | 52.7 /100 | #172 | Average 97.9% |
| Kenyans | 52.7 /100 | #173 | Average 97.9% |
| Immigrants | Micronesia | 50.0 /100 | #174 | Average 97.9% |
| Immigrants | Bosnia and Herzegovina | 49.8 /100 | #175 | Average 97.9% |