Immigrants from Italy vs Honduran 6th Grade
COMPARE
Immigrants from Italy
Honduran
6th Grade
6th Grade Comparison
Immigrants from Italy
Hondurans
97.1%
6TH GRADE
53.8/ 100
METRIC RATING
166th/ 347
METRIC RANK
95.0%
6TH GRADE
0.0/ 100
METRIC RATING
328th/ 347
METRIC RANK
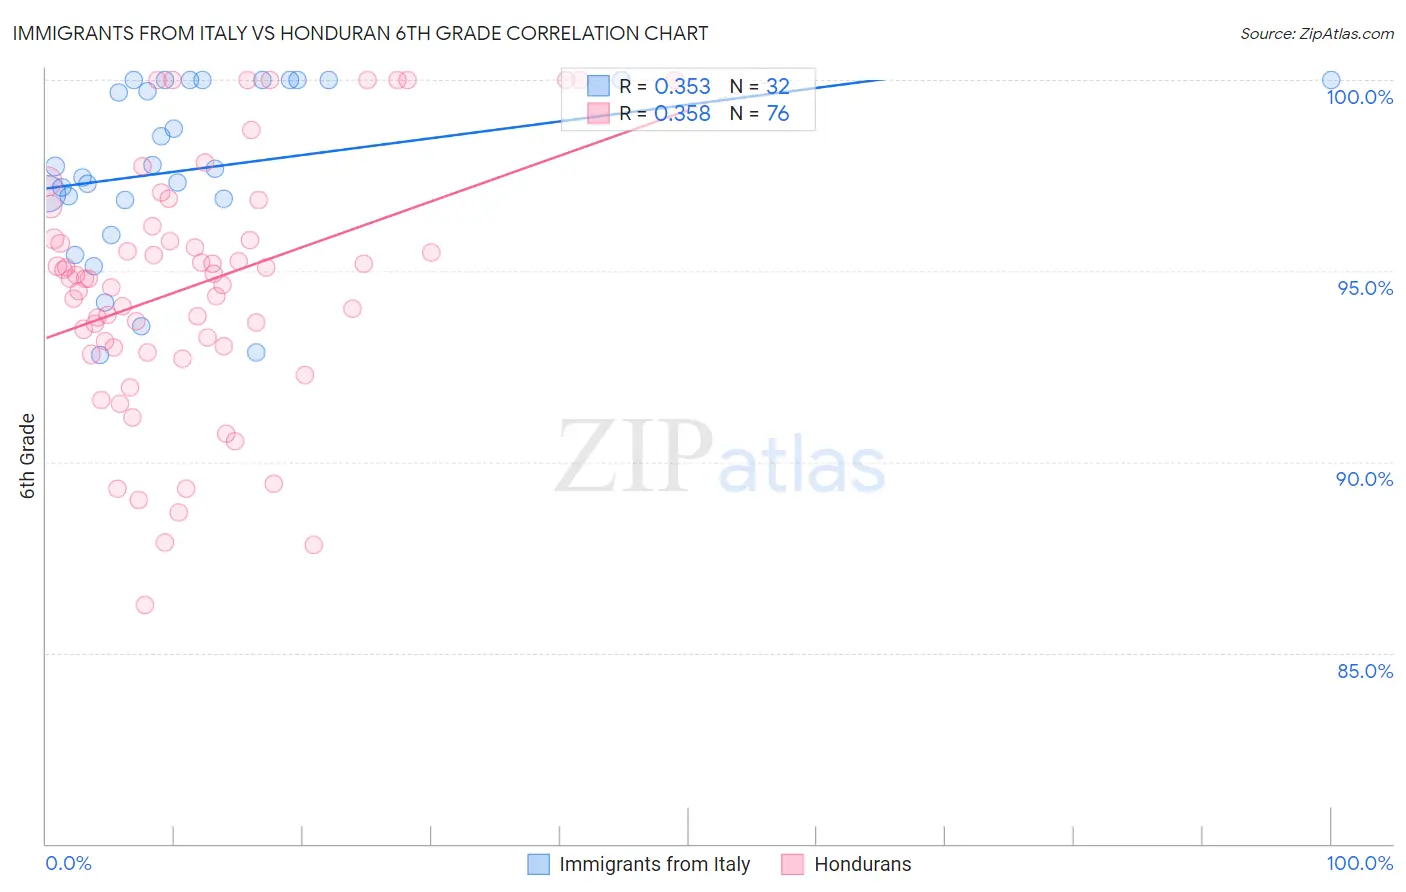
Immigrants from Italy vs Honduran 6th Grade Correlation Chart
The statistical analysis conducted on geographies consisting of 324,226,009 people shows a mild positive correlation between the proportion of Immigrants from Italy and percentage of population with at least 6th grade education in the United States with a correlation coefficient (R) of 0.353 and weighted average of 97.1%. Similarly, the statistical analysis conducted on geographies consisting of 357,784,803 people shows a mild positive correlation between the proportion of Hondurans and percentage of population with at least 6th grade education in the United States with a correlation coefficient (R) of 0.358 and weighted average of 95.0%, a difference of 2.2%.
6th Grade Correlation Summary
| Measurement | Immigrants from Italy | Honduran |
| Minimum | 92.8% | 86.2% |
| Maximum | 100.0% | 100.0% |
| Range | 7.2% | 13.8% |
| Mean | 97.7% | 94.6% |
| Median | 97.7% | 94.8% |
| Interquartile 25% (IQ1) | 96.9% | 93.0% |
| Interquartile 75% (IQ3) | 100.0% | 96.0% |
| Interquartile Range (IQR) | 3.1% | 3.0% |
| Standard Deviation (Sample) | 2.3% | 3.2% |
| Standard Deviation (Population) | 2.2% | 3.2% |
Similar Demographics by 6th Grade
Demographics Similar to Immigrants from Italy by 6th Grade
In terms of 6th grade, the demographic groups most similar to Immigrants from Italy are Apache (97.1%, a difference of 0.0%), Immigrants from Taiwan (97.1%, a difference of 0.0%), Immigrants from Poland (97.1%, a difference of 0.010%), Bermudan (97.1%, a difference of 0.010%), and Chilean (97.1%, a difference of 0.010%).
| Demographics | Rating | Rank | 6th Grade |
| Kenyans | 62.9 /100 | #159 | Good 97.1% |
| Ugandans | 62.2 /100 | #160 | Good 97.1% |
| Immigrants | Belarus | 60.4 /100 | #161 | Good 97.1% |
| Marshallese | 60.2 /100 | #162 | Good 97.1% |
| Albanians | 57.8 /100 | #163 | Average 97.1% |
| Immigrants | Korea | 57.7 /100 | #164 | Average 97.1% |
| Immigrants | Poland | 56.2 /100 | #165 | Average 97.1% |
| Immigrants | Italy | 53.8 /100 | #166 | Average 97.1% |
| Apache | 53.6 /100 | #167 | Average 97.1% |
| Immigrants | Taiwan | 53.5 /100 | #168 | Average 97.1% |
| Bermudans | 52.6 /100 | #169 | Average 97.1% |
| Chileans | 52.1 /100 | #170 | Average 97.1% |
| Immigrants | Sri Lanka | 51.7 /100 | #171 | Average 97.1% |
| Egyptians | 50.9 /100 | #172 | Average 97.1% |
| Arabs | 50.1 /100 | #173 | Average 97.0% |
Demographics Similar to Hondurans by 6th Grade
In terms of 6th grade, the demographic groups most similar to Hondurans are Mexican American Indian (95.0%, a difference of 0.010%), Hispanic or Latino (95.0%, a difference of 0.030%), Dominican (94.9%, a difference of 0.060%), Immigrants from Nicaragua (95.1%, a difference of 0.10%), and Cape Verdean (95.1%, a difference of 0.13%).
| Demographics | Rating | Rank | 6th Grade |
| Immigrants | Fiji | 0.0 /100 | #321 | Tragic 95.2% |
| Immigrants | Cambodia | 0.0 /100 | #322 | Tragic 95.2% |
| Central American Indians | 0.0 /100 | #323 | Tragic 95.1% |
| Cape Verdeans | 0.0 /100 | #324 | Tragic 95.1% |
| Immigrants | Nicaragua | 0.0 /100 | #325 | Tragic 95.1% |
| Hispanics or Latinos | 0.0 /100 | #326 | Tragic 95.0% |
| Mexican American Indians | 0.0 /100 | #327 | Tragic 95.0% |
| Hondurans | 0.0 /100 | #328 | Tragic 95.0% |
| Dominicans | 0.0 /100 | #329 | Tragic 94.9% |
| Nepalese | 0.0 /100 | #330 | Tragic 94.9% |
| Immigrants | Armenia | 0.0 /100 | #331 | Tragic 94.9% |
| Immigrants | Honduras | 0.0 /100 | #332 | Tragic 94.8% |
| Immigrants | Latin America | 0.0 /100 | #333 | Tragic 94.7% |
| Immigrants | Azores | 0.0 /100 | #334 | Tragic 94.7% |
| Mexicans | 0.0 /100 | #335 | Tragic 94.6% |