Immigrants from Israel vs West Indian 6th Grade
COMPARE
Immigrants from Israel
West Indian
6th Grade
6th Grade Comparison
Immigrants from Israel
West Indians
97.2%
6TH GRADE
76.0/ 100
METRIC RATING
149th/ 347
METRIC RANK
96.3%
6TH GRADE
0.2/ 100
METRIC RATING
269th/ 347
METRIC RANK
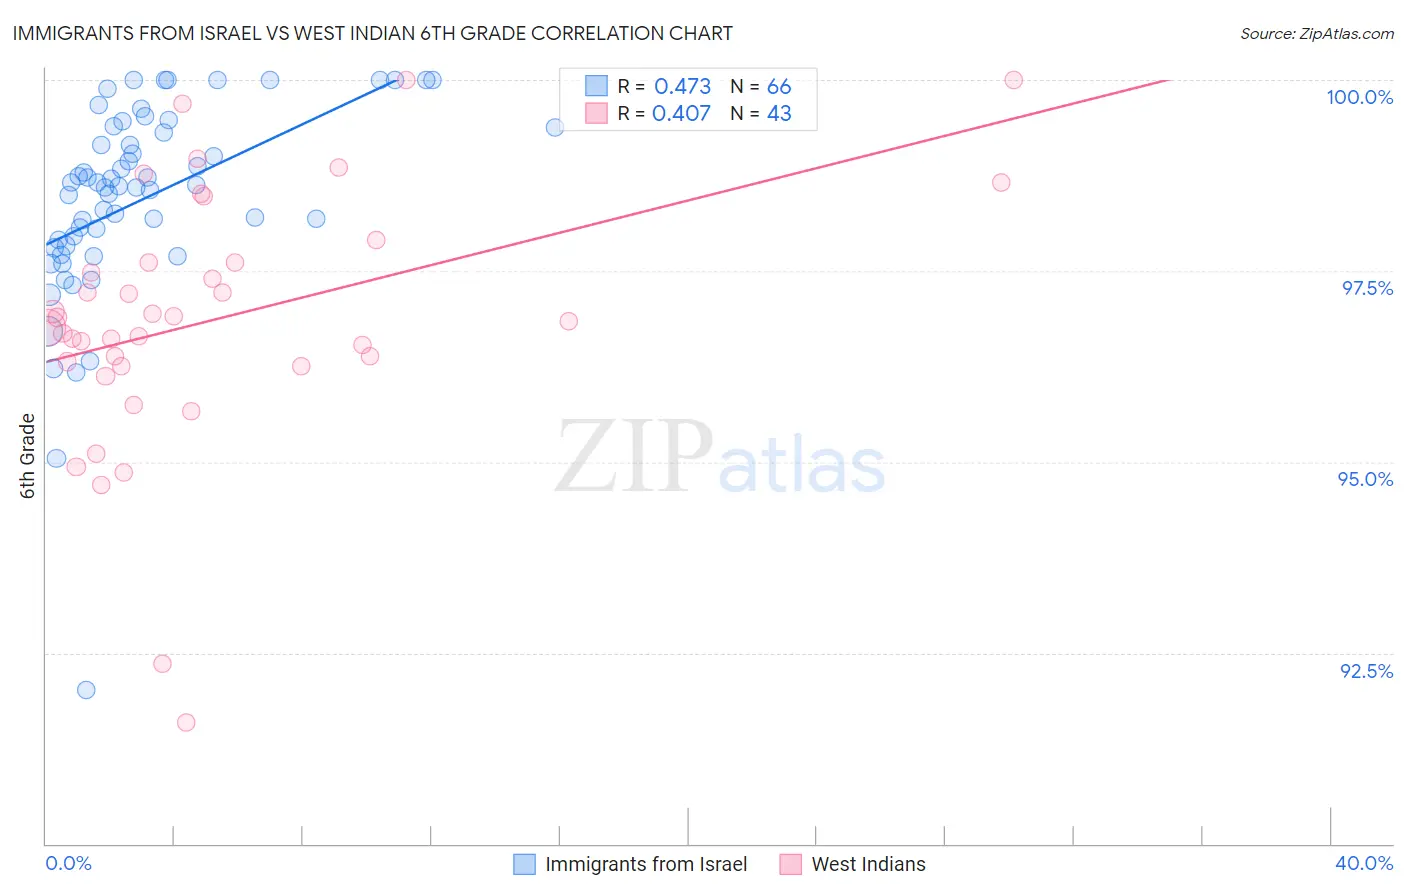
Immigrants from Israel vs West Indian 6th Grade Correlation Chart
The statistical analysis conducted on geographies consisting of 210,029,773 people shows a moderate positive correlation between the proportion of Immigrants from Israel and percentage of population with at least 6th grade education in the United States with a correlation coefficient (R) of 0.473 and weighted average of 97.2%. Similarly, the statistical analysis conducted on geographies consisting of 254,059,006 people shows a moderate positive correlation between the proportion of West Indians and percentage of population with at least 6th grade education in the United States with a correlation coefficient (R) of 0.407 and weighted average of 96.3%, a difference of 0.87%.
6th Grade Correlation Summary
| Measurement | Immigrants from Israel | West Indian |
| Minimum | 92.0% | 91.6% |
| Maximum | 100.0% | 100.0% |
| Range | 8.0% | 8.4% |
| Mean | 98.4% | 96.9% |
| Median | 98.6% | 96.8% |
| Interquartile 25% (IQ1) | 97.8% | 96.3% |
| Interquartile 75% (IQ3) | 99.4% | 97.6% |
| Interquartile Range (IQR) | 1.6% | 1.4% |
| Standard Deviation (Sample) | 1.3% | 1.7% |
| Standard Deviation (Population) | 1.3% | 1.7% |
Similar Demographics by 6th Grade
Demographics Similar to Immigrants from Israel by 6th Grade
In terms of 6th grade, the demographic groups most similar to Immigrants from Israel are Immigrants from South Central Asia (97.2%, a difference of 0.010%), Immigrants from Greece (97.2%, a difference of 0.010%), Immigrants from Bosnia and Herzegovina (97.2%, a difference of 0.010%), French American Indian (97.2%, a difference of 0.010%), and Hopi (97.2%, a difference of 0.020%).
| Demographics | Rating | Rank | 6th Grade |
| Jordanians | 84.6 /100 | #142 | Excellent 97.2% |
| Pima | 82.9 /100 | #143 | Excellent 97.2% |
| Israelis | 82.9 /100 | #144 | Excellent 97.2% |
| Spaniards | 80.1 /100 | #145 | Excellent 97.2% |
| Hopi | 78.8 /100 | #146 | Good 97.2% |
| Immigrants | South Central Asia | 78.1 /100 | #147 | Good 97.2% |
| Immigrants | Greece | 77.8 /100 | #148 | Good 97.2% |
| Immigrants | Israel | 76.0 /100 | #149 | Good 97.2% |
| Immigrants | Bosnia and Herzegovina | 74.8 /100 | #150 | Good 97.2% |
| French American Indians | 74.0 /100 | #151 | Good 97.2% |
| Immigrants | Jordan | 73.0 /100 | #152 | Good 97.2% |
| Immigrants | Eastern Europe | 72.6 /100 | #153 | Good 97.2% |
| Soviet Union | 71.5 /100 | #154 | Good 97.2% |
| Ute | 71.1 /100 | #155 | Good 97.1% |
| Alsatians | 69.8 /100 | #156 | Good 97.1% |
Demographics Similar to West Indians by 6th Grade
In terms of 6th grade, the demographic groups most similar to West Indians are Immigrants from Uzbekistan (96.3%, a difference of 0.0%), Immigrants from South America (96.3%, a difference of 0.0%), Immigrants from Hong Kong (96.3%, a difference of 0.010%), Ghanaian (96.4%, a difference of 0.030%), and Afghan (96.4%, a difference of 0.030%).
| Demographics | Rating | Rank | 6th Grade |
| Immigrants | Nigeria | 0.3 /100 | #262 | Tragic 96.4% |
| Immigrants | Colombia | 0.3 /100 | #263 | Tragic 96.4% |
| Armenians | 0.3 /100 | #264 | Tragic 96.4% |
| Immigrants | Jamaica | 0.2 /100 | #265 | Tragic 96.4% |
| Ghanaians | 0.2 /100 | #266 | Tragic 96.4% |
| Afghans | 0.2 /100 | #267 | Tragic 96.4% |
| Immigrants | Uzbekistan | 0.2 /100 | #268 | Tragic 96.3% |
| West Indians | 0.2 /100 | #269 | Tragic 96.3% |
| Immigrants | South America | 0.2 /100 | #270 | Tragic 96.3% |
| Immigrants | Hong Kong | 0.2 /100 | #271 | Tragic 96.3% |
| Immigrants | Bolivia | 0.1 /100 | #272 | Tragic 96.3% |
| Immigrants | Cameroon | 0.1 /100 | #273 | Tragic 96.3% |
| Immigrants | Philippines | 0.1 /100 | #274 | Tragic 96.3% |
| Immigrants | Ghana | 0.1 /100 | #275 | Tragic 96.3% |
| Yaqui | 0.1 /100 | #276 | Tragic 96.3% |