Immigrants from Israel vs Immigrants from Sri Lanka GED/Equivalency
COMPARE
Immigrants from Israel
Immigrants from Sri Lanka
GED/Equivalency
GED/Equivalency Comparison
Immigrants from Israel
Immigrants from Sri Lanka
88.2%
GED/EQUIVALENCY
99.6/ 100
METRIC RATING
39th/ 347
METRIC RANK
87.5%
GED/EQUIVALENCY
98.3/ 100
METRIC RATING
81st/ 347
METRIC RANK
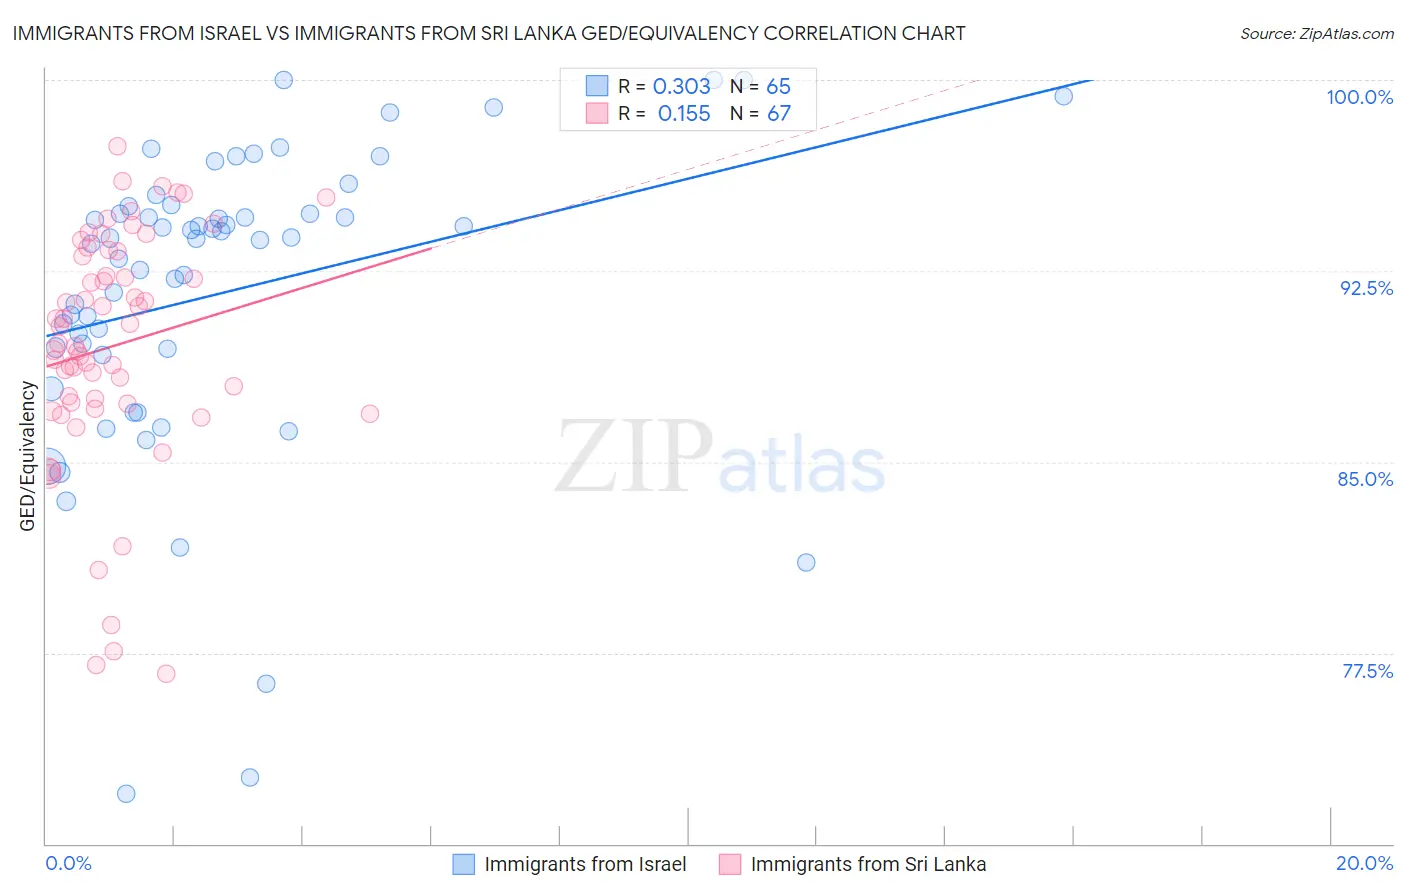
Immigrants from Israel vs Immigrants from Sri Lanka GED/Equivalency Correlation Chart
The statistical analysis conducted on geographies consisting of 210,029,020 people shows a mild positive correlation between the proportion of Immigrants from Israel and percentage of population with at least ged/equivalency education in the United States with a correlation coefficient (R) of 0.303 and weighted average of 88.2%. Similarly, the statistical analysis conducted on geographies consisting of 149,671,972 people shows a poor positive correlation between the proportion of Immigrants from Sri Lanka and percentage of population with at least ged/equivalency education in the United States with a correlation coefficient (R) of 0.155 and weighted average of 87.5%, a difference of 0.76%.
GED/Equivalency Correlation Summary
| Measurement | Immigrants from Israel | Immigrants from Sri Lanka |
| Minimum | 72.0% | 76.7% |
| Maximum | 100.0% | 97.4% |
| Range | 28.0% | 20.7% |
| Mean | 91.7% | 89.5% |
| Median | 93.8% | 89.6% |
| Interquartile 25% (IQ1) | 89.3% | 87.3% |
| Interquartile 75% (IQ3) | 94.9% | 93.3% |
| Interquartile Range (IQR) | 5.6% | 6.0% |
| Standard Deviation (Sample) | 6.0% | 4.6% |
| Standard Deviation (Population) | 6.0% | 4.6% |
Similar Demographics by GED/Equivalency
Demographics Similar to Immigrants from Israel by GED/Equivalency
In terms of ged/equivalency, the demographic groups most similar to Immigrants from Israel are Italian (88.2%, a difference of 0.020%), Finnish (88.2%, a difference of 0.030%), Cambodian (88.2%, a difference of 0.060%), Immigrants from Scotland (88.2%, a difference of 0.070%), and Burmese (88.3%, a difference of 0.090%).
| Demographics | Rating | Rank | GED/Equivalency |
| Danes | 99.8 /100 | #32 | Exceptional 88.4% |
| Immigrants | Sweden | 99.7 /100 | #33 | Exceptional 88.4% |
| Immigrants | Japan | 99.7 /100 | #34 | Exceptional 88.4% |
| Immigrants | South Central Asia | 99.7 /100 | #35 | Exceptional 88.4% |
| Immigrants | Belgium | 99.7 /100 | #36 | Exceptional 88.3% |
| Immigrants | Austria | 99.7 /100 | #37 | Exceptional 88.3% |
| Burmese | 99.7 /100 | #38 | Exceptional 88.3% |
| Immigrants | Israel | 99.6 /100 | #39 | Exceptional 88.2% |
| Italians | 99.6 /100 | #40 | Exceptional 88.2% |
| Finns | 99.6 /100 | #41 | Exceptional 88.2% |
| Cambodians | 99.6 /100 | #42 | Exceptional 88.2% |
| Immigrants | Scotland | 99.6 /100 | #43 | Exceptional 88.2% |
| Macedonians | 99.5 /100 | #44 | Exceptional 88.1% |
| Czechs | 99.5 /100 | #45 | Exceptional 88.1% |
| Immigrants | Switzerland | 99.5 /100 | #46 | Exceptional 88.1% |
Demographics Similar to Immigrants from Sri Lanka by GED/Equivalency
In terms of ged/equivalency, the demographic groups most similar to Immigrants from Sri Lanka are Romanian (87.5%, a difference of 0.010%), South African (87.5%, a difference of 0.010%), Immigrants from England (87.6%, a difference of 0.040%), Immigrants from Romania (87.5%, a difference of 0.050%), and Dutch (87.5%, a difference of 0.050%).
| Demographics | Rating | Rank | GED/Equivalency |
| Immigrants | Kuwait | 98.8 /100 | #74 | Exceptional 87.7% |
| Scottish | 98.7 /100 | #75 | Exceptional 87.7% |
| Immigrants | Serbia | 98.7 /100 | #76 | Exceptional 87.7% |
| Slavs | 98.7 /100 | #77 | Exceptional 87.7% |
| Irish | 98.6 /100 | #78 | Exceptional 87.6% |
| English | 98.6 /100 | #79 | Exceptional 87.6% |
| Immigrants | England | 98.5 /100 | #80 | Exceptional 87.6% |
| Immigrants | Sri Lanka | 98.3 /100 | #81 | Exceptional 87.5% |
| Romanians | 98.3 /100 | #82 | Exceptional 87.5% |
| South Africans | 98.3 /100 | #83 | Exceptional 87.5% |
| Immigrants | Romania | 98.1 /100 | #84 | Exceptional 87.5% |
| Dutch | 98.1 /100 | #85 | Exceptional 87.5% |
| Immigrants | Europe | 98.1 /100 | #86 | Exceptional 87.5% |
| Native Hawaiians | 98.1 /100 | #87 | Exceptional 87.5% |
| Immigrants | Norway | 98.1 /100 | #88 | Exceptional 87.5% |