Immigrants from Israel vs Immigrants from Africa Master's Degree
COMPARE
Immigrants from Israel
Immigrants from Africa
Master's Degree
Master's Degree Comparison
Immigrants from Israel
Immigrants from Africa
22.6%
MASTER'S DEGREE
100.0/ 100
METRIC RATING
3rd/ 347
METRIC RANK
15.7%
MASTER'S DEGREE
84.0/ 100
METRIC RATING
142nd/ 347
METRIC RANK
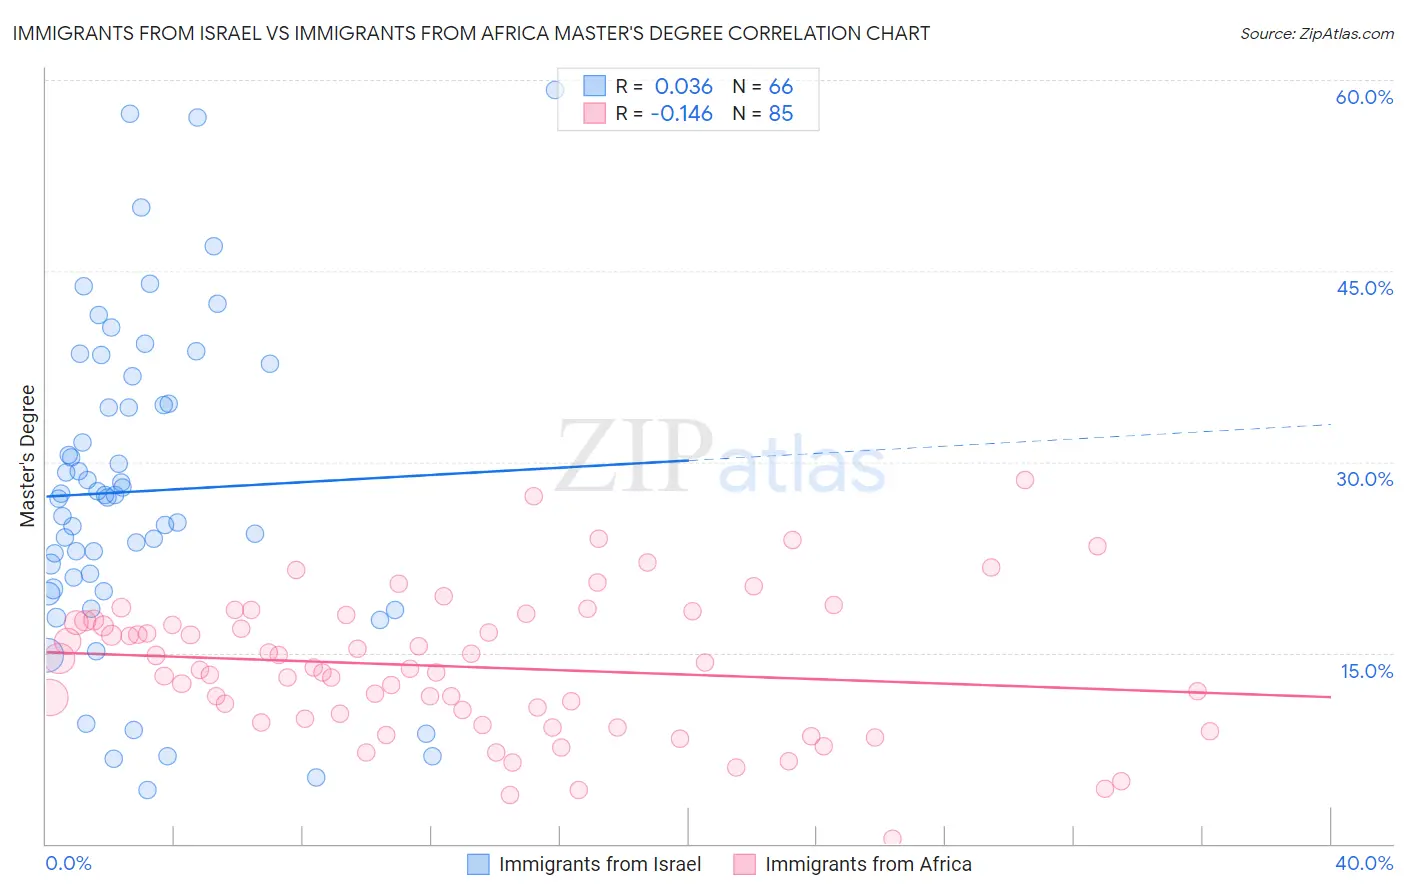
Immigrants from Israel vs Immigrants from Africa Master's Degree Correlation Chart
The statistical analysis conducted on geographies consisting of 210,015,600 people shows no correlation between the proportion of Immigrants from Israel and percentage of population with at least master's degree education in the United States with a correlation coefficient (R) of 0.036 and weighted average of 22.6%. Similarly, the statistical analysis conducted on geographies consisting of 469,202,682 people shows a poor negative correlation between the proportion of Immigrants from Africa and percentage of population with at least master's degree education in the United States with a correlation coefficient (R) of -0.146 and weighted average of 15.7%, a difference of 44.1%.
Master's Degree Correlation Summary
| Measurement | Immigrants from Israel | Immigrants from Africa |
| Minimum | 4.2% | 0.40% |
| Maximum | 59.3% | 28.6% |
| Range | 55.1% | 28.2% |
| Mean | 27.7% | 13.9% |
| Median | 27.3% | 13.7% |
| Interquartile 25% (IQ1) | 20.0% | 9.7% |
| Interquartile 75% (IQ3) | 34.6% | 17.5% |
| Interquartile Range (IQR) | 14.6% | 7.9% |
| Standard Deviation (Sample) | 12.5% | 5.5% |
| Standard Deviation (Population) | 12.4% | 5.5% |
Similar Demographics by Master's Degree
Demographics Similar to Immigrants from Israel by Master's Degree
In terms of master's degree, the demographic groups most similar to Immigrants from Israel are Okinawan (22.6%, a difference of 0.0%), Immigrants from Taiwan (22.5%, a difference of 0.80%), Immigrants from India (22.3%, a difference of 1.5%), Iranian (22.3%, a difference of 1.7%), and Filipino (23.4%, a difference of 3.4%).
| Demographics | Rating | Rank | Master's Degree |
| Immigrants | Singapore | 100.0 /100 | #1 | Exceptional 23.4% |
| Filipinos | 100.0 /100 | #2 | Exceptional 23.4% |
| Immigrants | Israel | 100.0 /100 | #3 | Exceptional 22.6% |
| Okinawans | 100.0 /100 | #4 | Exceptional 22.6% |
| Immigrants | Taiwan | 100.0 /100 | #5 | Exceptional 22.5% |
| Immigrants | India | 100.0 /100 | #6 | Exceptional 22.3% |
| Iranians | 100.0 /100 | #7 | Exceptional 22.3% |
| Cypriots | 100.0 /100 | #8 | Exceptional 21.8% |
| Thais | 100.0 /100 | #9 | Exceptional 21.7% |
| Immigrants | Iran | 100.0 /100 | #10 | Exceptional 21.6% |
| Immigrants | China | 100.0 /100 | #11 | Exceptional 21.2% |
| Eastern Europeans | 100.0 /100 | #12 | Exceptional 21.1% |
| Immigrants | Australia | 100.0 /100 | #13 | Exceptional 20.9% |
| Immigrants | Switzerland | 100.0 /100 | #14 | Exceptional 20.9% |
| Immigrants | Eastern Asia | 100.0 /100 | #15 | Exceptional 20.8% |
Demographics Similar to Immigrants from Africa by Master's Degree
In terms of master's degree, the demographic groups most similar to Immigrants from Africa are Immigrants from Venezuela (15.7%, a difference of 0.090%), Canadian (15.7%, a difference of 0.17%), Polish (15.7%, a difference of 0.23%), Vietnamese (15.8%, a difference of 0.36%), and Immigrants from Germany (15.8%, a difference of 0.44%).
| Demographics | Rating | Rank | Master's Degree |
| South American Indians | 88.4 /100 | #135 | Excellent 15.9% |
| Assyrians/Chaldeans/Syriacs | 86.8 /100 | #136 | Excellent 15.8% |
| Europeans | 86.4 /100 | #137 | Excellent 15.8% |
| Pakistanis | 86.1 /100 | #138 | Excellent 15.8% |
| Immigrants | Germany | 85.9 /100 | #139 | Excellent 15.8% |
| Vietnamese | 85.5 /100 | #140 | Excellent 15.8% |
| Poles | 85.0 /100 | #141 | Excellent 15.7% |
| Immigrants | Africa | 84.0 /100 | #142 | Excellent 15.7% |
| Immigrants | Venezuela | 83.6 /100 | #143 | Excellent 15.7% |
| Canadians | 83.3 /100 | #144 | Excellent 15.7% |
| South Americans | 81.3 /100 | #145 | Excellent 15.6% |
| Immigrants | Afghanistan | 79.4 /100 | #146 | Good 15.6% |
| Hungarians | 79.1 /100 | #147 | Good 15.6% |
| Immigrants | Senegal | 78.2 /100 | #148 | Good 15.5% |
| Ghanaians | 78.2 /100 | #149 | Good 15.5% |