Immigrants from Israel vs Guamanian/Chamorro 11th Grade
COMPARE
Immigrants from Israel
Guamanian/Chamorro
11th Grade
11th Grade Comparison
Immigrants from Israel
Guamanians/Chamorros
93.5%
11TH GRADE
98.8/ 100
METRIC RATING
98th/ 347
METRIC RANK
92.5%
11TH GRADE
45.0/ 100
METRIC RATING
177th/ 347
METRIC RANK
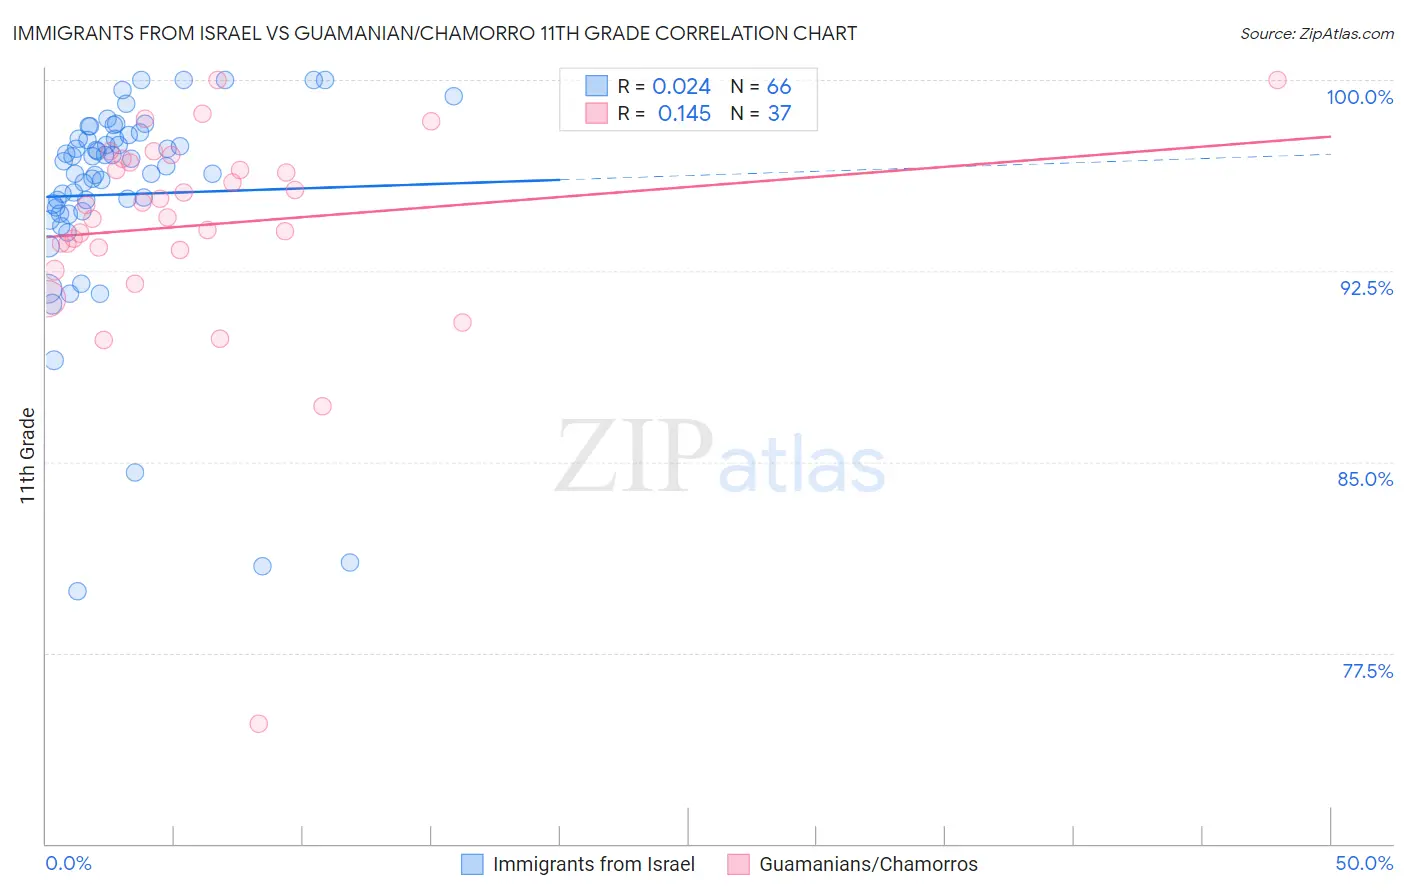
Immigrants from Israel vs Guamanian/Chamorro 11th Grade Correlation Chart
The statistical analysis conducted on geographies consisting of 210,030,386 people shows no correlation between the proportion of Immigrants from Israel and percentage of population with at least 11th grade education in the United States with a correlation coefficient (R) of 0.024 and weighted average of 93.5%. Similarly, the statistical analysis conducted on geographies consisting of 221,965,618 people shows a poor positive correlation between the proportion of Guamanians/Chamorros and percentage of population with at least 11th grade education in the United States with a correlation coefficient (R) of 0.145 and weighted average of 92.5%, a difference of 1.1%.
11th Grade Correlation Summary
| Measurement | Immigrants from Israel | Guamanian/Chamorro |
| Minimum | 79.9% | 74.7% |
| Maximum | 100.0% | 100.0% |
| Range | 20.1% | 25.3% |
| Mean | 95.5% | 94.3% |
| Median | 96.7% | 95.1% |
| Interquartile 25% (IQ1) | 94.8% | 93.4% |
| Interquartile 75% (IQ3) | 97.7% | 96.8% |
| Interquartile Range (IQR) | 2.9% | 3.5% |
| Standard Deviation (Sample) | 4.3% | 4.4% |
| Standard Deviation (Population) | 4.2% | 4.3% |
Similar Demographics by 11th Grade
Demographics Similar to Immigrants from Israel by 11th Grade
In terms of 11th grade, the demographic groups most similar to Immigrants from Israel are Menominee (93.5%, a difference of 0.0%), Immigrants from North Macedonia (93.5%, a difference of 0.010%), Immigrants from Iran (93.5%, a difference of 0.020%), Immigrants from Romania (93.5%, a difference of 0.020%), and Immigrants from Turkey (93.5%, a difference of 0.030%).
| Demographics | Rating | Rank | 11th Grade |
| South Africans | 99.2 /100 | #91 | Exceptional 93.6% |
| Immigrants | Bulgaria | 99.1 /100 | #92 | Exceptional 93.6% |
| Puget Sound Salish | 99.1 /100 | #93 | Exceptional 93.6% |
| Swiss | 99.0 /100 | #94 | Exceptional 93.6% |
| Immigrants | France | 99.0 /100 | #95 | Exceptional 93.6% |
| Immigrants | Turkey | 98.9 /100 | #96 | Exceptional 93.5% |
| Immigrants | Iran | 98.9 /100 | #97 | Exceptional 93.5% |
| Immigrants | Israel | 98.8 /100 | #98 | Exceptional 93.5% |
| Menominee | 98.7 /100 | #99 | Exceptional 93.5% |
| Immigrants | North Macedonia | 98.7 /100 | #100 | Exceptional 93.5% |
| Immigrants | Romania | 98.7 /100 | #101 | Exceptional 93.5% |
| Chippewa | 98.6 /100 | #102 | Exceptional 93.5% |
| Lebanese | 98.6 /100 | #103 | Exceptional 93.5% |
| Immigrants | Europe | 98.6 /100 | #104 | Exceptional 93.5% |
| Immigrants | Serbia | 98.6 /100 | #105 | Exceptional 93.5% |
Demographics Similar to Guamanians/Chamorros by 11th Grade
In terms of 11th grade, the demographic groups most similar to Guamanians/Chamorros are Spaniard (92.5%, a difference of 0.020%), Sudanese (92.5%, a difference of 0.020%), Shoshone (92.5%, a difference of 0.040%), Creek (92.4%, a difference of 0.040%), and Inupiat (92.4%, a difference of 0.040%).
| Demographics | Rating | Rank | 11th Grade |
| Immigrants | Northern Africa | 57.3 /100 | #170 | Average 92.6% |
| Laotians | 54.4 /100 | #171 | Average 92.6% |
| Immigrants | Pakistan | 52.3 /100 | #172 | Average 92.5% |
| Indians (Asian) | 51.5 /100 | #173 | Average 92.5% |
| Asians | 50.0 /100 | #174 | Average 92.5% |
| Shoshone | 48.9 /100 | #175 | Average 92.5% |
| Spaniards | 46.9 /100 | #176 | Average 92.5% |
| Guamanians/Chamorros | 45.0 /100 | #177 | Average 92.5% |
| Sudanese | 43.4 /100 | #178 | Average 92.5% |
| Creek | 40.9 /100 | #179 | Average 92.4% |
| Inupiat | 40.7 /100 | #180 | Average 92.4% |
| Cherokee | 40.7 /100 | #181 | Average 92.4% |
| Immigrants | Morocco | 38.6 /100 | #182 | Fair 92.4% |
| Immigrants | Malaysia | 37.6 /100 | #183 | Fair 92.4% |
| Immigrants | Asia | 37.4 /100 | #184 | Fair 92.4% |