Immigrants from Israel vs African 12th Grade, No Diploma
COMPARE
Immigrants from Israel
African
12th Grade, No Diploma
12th Grade, No Diploma Comparison
Immigrants from Israel
Africans
92.5%
12TH GRADE, NO DIPLOMA
99.2/ 100
METRIC RATING
83rd/ 347
METRIC RANK
89.6%
12TH GRADE, NO DIPLOMA
0.4/ 100
METRIC RATING
258th/ 347
METRIC RANK
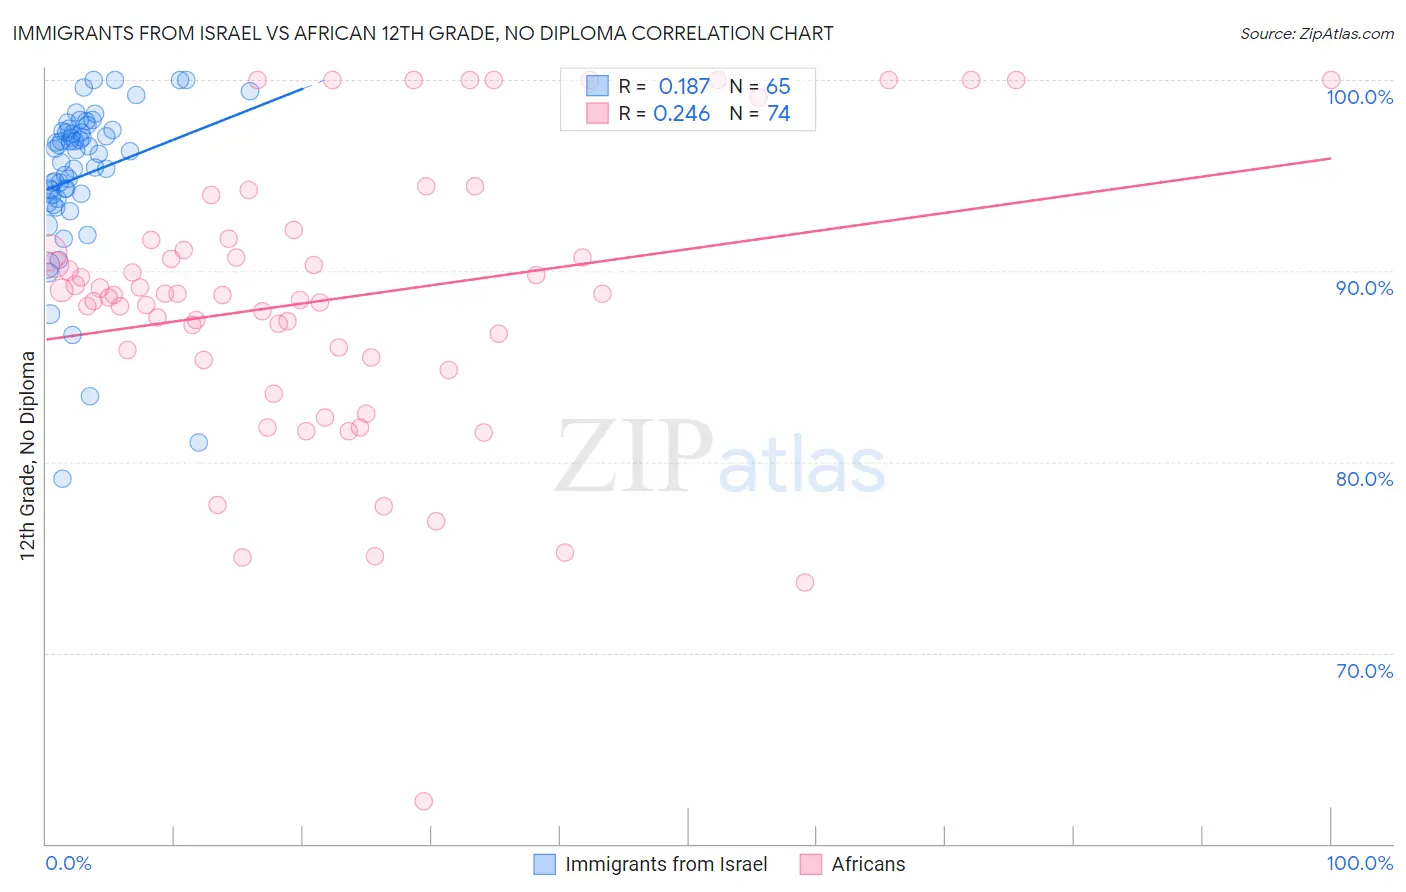
Immigrants from Israel vs African 12th Grade, No Diploma Correlation Chart
The statistical analysis conducted on geographies consisting of 210,029,020 people shows a poor positive correlation between the proportion of Immigrants from Israel and percentage of population with at least 12th grade (no diploma) education in the United States with a correlation coefficient (R) of 0.187 and weighted average of 92.5%. Similarly, the statistical analysis conducted on geographies consisting of 470,094,658 people shows a weak positive correlation between the proportion of Africans and percentage of population with at least 12th grade (no diploma) education in the United States with a correlation coefficient (R) of 0.246 and weighted average of 89.6%, a difference of 3.2%.
12th Grade, No Diploma Correlation Summary
| Measurement | Immigrants from Israel | African |
| Minimum | 79.1% | 62.2% |
| Maximum | 100.0% | 100.0% |
| Range | 20.9% | 37.8% |
| Mean | 95.0% | 88.6% |
| Median | 96.3% | 88.8% |
| Interquartile 25% (IQ1) | 93.9% | 85.4% |
| Interquartile 75% (IQ3) | 97.3% | 91.6% |
| Interquartile Range (IQR) | 3.5% | 6.2% |
| Standard Deviation (Sample) | 4.2% | 7.4% |
| Standard Deviation (Population) | 4.1% | 7.3% |
Similar Demographics by 12th Grade, No Diploma
Demographics Similar to Immigrants from Israel by 12th Grade, No Diploma
In terms of 12th grade, no diploma, the demographic groups most similar to Immigrants from Israel are Immigrants from Denmark (92.5%, a difference of 0.010%), Immigrants from Switzerland (92.5%, a difference of 0.010%), French Canadian (92.6%, a difference of 0.030%), Cambodian (92.6%, a difference of 0.050%), and Romanian (92.6%, a difference of 0.050%).
| Demographics | Rating | Rank | 12th Grade, No Diploma |
| French | 99.4 /100 | #76 | Exceptional 92.6% |
| Immigrants | England | 99.4 /100 | #77 | Exceptional 92.6% |
| Cambodians | 99.3 /100 | #78 | Exceptional 92.6% |
| Romanians | 99.3 /100 | #79 | Exceptional 92.6% |
| French Canadians | 99.3 /100 | #80 | Exceptional 92.6% |
| Immigrants | Denmark | 99.2 /100 | #81 | Exceptional 92.5% |
| Immigrants | Switzerland | 99.2 /100 | #82 | Exceptional 92.5% |
| Immigrants | Israel | 99.2 /100 | #83 | Exceptional 92.5% |
| Immigrants | Bulgaria | 99.1 /100 | #84 | Exceptional 92.5% |
| Immigrants | Saudi Arabia | 99.0 /100 | #85 | Exceptional 92.5% |
| Immigrants | Turkey | 98.9 /100 | #86 | Exceptional 92.4% |
| Immigrants | France | 98.8 /100 | #87 | Exceptional 92.4% |
| Scotch-Irish | 98.8 /100 | #88 | Exceptional 92.4% |
| Canadians | 98.7 /100 | #89 | Exceptional 92.4% |
| Immigrants | Serbia | 98.6 /100 | #90 | Exceptional 92.4% |
Demographics Similar to Africans by 12th Grade, No Diploma
In terms of 12th grade, no diploma, the demographic groups most similar to Africans are Immigrants from Western Africa (89.6%, a difference of 0.020%), Immigrants from South Eastern Asia (89.6%, a difference of 0.040%), Cheyenne (89.6%, a difference of 0.040%), Sioux (89.6%, a difference of 0.040%), and Immigrants from Ghana (89.7%, a difference of 0.050%).
| Demographics | Rating | Rank | 12th Grade, No Diploma |
| Spanish Americans | 0.9 /100 | #251 | Tragic 89.9% |
| Bahamians | 0.9 /100 | #252 | Tragic 89.9% |
| Choctaw | 0.7 /100 | #253 | Tragic 89.8% |
| Immigrants | Peru | 0.5 /100 | #254 | Tragic 89.7% |
| Immigrants | Senegal | 0.5 /100 | #255 | Tragic 89.7% |
| Immigrants | Ghana | 0.5 /100 | #256 | Tragic 89.7% |
| Jamaicans | 0.5 /100 | #257 | Tragic 89.7% |
| Africans | 0.4 /100 | #258 | Tragic 89.6% |
| Immigrants | Western Africa | 0.4 /100 | #259 | Tragic 89.6% |
| Immigrants | South Eastern Asia | 0.4 /100 | #260 | Tragic 89.6% |
| Cheyenne | 0.4 /100 | #261 | Tragic 89.6% |
| Sioux | 0.4 /100 | #262 | Tragic 89.6% |
| Immigrants | Jamaica | 0.2 /100 | #263 | Tragic 89.5% |
| Sri Lankans | 0.2 /100 | #264 | Tragic 89.4% |
| Trinidadians and Tobagonians | 0.2 /100 | #265 | Tragic 89.4% |