Immigrants from Ireland vs Immigrants from South Central Asia High School Diploma

COMPARE

Immigrants from Ireland
Race
Ancestry
AfghanAfricanAlaska NativeAlaskan AthabascanAlbanianAleutAlsatianAmericanApacheArabArapahoArgentineanArmenianAssyrian/Chaldean/SyriacAustralianAustrianBahamianBangladeshiBarbadianBasqueBelgianBelizeanBermudanBhutaneseBlackfeetBolivianBrazilianBritishBritish West IndianBulgarianBurmeseCajunCambodianCanadianCape VerdeanCarpatho RusynCelticCentral AmericanCentral American IndianCherokeeCheyenneChickasawChileanChineseChippewaChoctawColombianColvilleComancheCosta RicanCreeCreekCroatianCrowCubanCypriotCzechCzechoslovakianDanishDelawareDominicanDutchDutch West IndianEastern EuropeanEcuadorianEgyptianEnglishEstonianEthiopianEuropeanFijianFilipinoFinnishFrenchFrench American IndianFrench CanadianGermanGerman RussianGhanaianGreekGuamanian/ChamorroGuatemalanGuyaneseHaitianHmongHonduranHopiHoumaHungarianIcelanderIndian (Asian)IndonesianInupiatIranianIraqiIrishIroquoisIsraeliItalianJamaicanJapaneseJordanianKenyanKiowaKoreanLaotianLatvianLebaneseLiberianLithuanianLumbeeLuxembourgerMacedonianMalaysianMalteseMarshalleseMenomineeMexicanMexican American IndianMongolianMoroccanNative HawaiianNavajoNepaleseNew ZealanderNicaraguanNigerianNorthern EuropeanNorwegianOkinawanOsageOttawaPaiutePakistaniPalestinianPanamanianParaguayanPennsylvania GermanPeruvianPimaPolishPortuguesePotawatomiPuebloPuerto RicanPuget Sound SalishRomanianRussianSalvadoranSamoanScandinavianScotch-IrishScottishSeminoleSenegaleseSerbianShoshoneSierra LeoneanSiouxSlavicSlovakSloveneSomaliSouth AfricanSouth AmericanSouth American IndianSoviet UnionSpaniardSpanishSpanish AmericanSpanish American IndianSri LankanSubsaharan AfricanSudaneseSwedishSwissSyrianTaiwaneseThaiTlingit-HaidaTohono O'OdhamTonganTrinidadian and TobagonianTsimshianTurkishU.S. Virgin IslanderUgandanUkrainianUruguayanUteVenezuelanVietnameseWelshWest IndianYakamaYaquiYugoslavianYumanYup'ikZimbabwean
Immigration
NonimmigrantsImmigrantsAfghanistanAfricaAlbaniaArgentinaArmeniaAsiaAustraliaAustriaBahamasBangladeshBarbadosBelarusBelgiumBelizeBoliviaBosnia and HerzegovinaBrazilBulgariaBurma/MyanmarCabo VerdeCambodiaCameroonCanadaCaribbeanCentral AmericaChileChinaColombiaCongoCosta RicaCroatiaCubaCzechoslovakiaDenmarkDominicaDominican RepublicEastern AfricaEastern AsiaEastern EuropeEcuadorEgyptEl SalvadorEnglandEritreaEthiopiaEuropeFijiFranceGermanyGhanaGreeceGrenadaGuatemalaGuyanaHaitiHondurasHong KongHungaryIndiaIndonesiaIranIraqIrelandIsraelItalyJamaicaJapanJordanKazakhstanKenyaKoreaKuwaitLaosLatin AmericaLatviaLebanonLiberiaLithuaniaMalaysiaMexicoMicronesiaMiddle AfricaMoldovaMoroccoNepalNetherlandsNicaraguaNigeriaNorth AmericaNorth MacedoniaNorthern AfricaNorthern EuropeNorwayOceaniaPakistanPanamaPeruPhilippinesPolandPortugalRomaniaRussiaSaudi ArabiaScotlandSenegalSerbiaSierra LeoneSingaporeSomaliaSouth AfricaSouth AmericaSouth Eastern AsiaSouthern EuropeSpainSri LankaSt. Vincent and the GrenadinesSudanSwedenSwitzerlandSyriaTaiwanThailandTrinidad and TobagoTurkeyUgandaUkraineUruguayUzbekistanVenezuelaVietnamWest IndiesWestern AfricaWestern AsiaWestern EuropeYemenZaireZimbabweAzores
Immigrants from South Central Asia
Race
Ancestry
AfghanAfricanAlaska NativeAlaskan AthabascanAlbanianAleutAlsatianAmericanApacheArabArapahoArgentineanArmenianAssyrian/Chaldean/SyriacAustralianAustrianBahamianBangladeshiBarbadianBasqueBelgianBelizeanBermudanBhutaneseBlackfeetBolivianBrazilianBritishBritish West IndianBulgarianBurmeseCajunCambodianCanadianCape VerdeanCarpatho RusynCelticCentral AmericanCentral American IndianCherokeeCheyenneChickasawChileanChineseChippewaChoctawColombianColvilleComancheCosta RicanCreeCreekCroatianCrowCubanCypriotCzechCzechoslovakianDanishDelawareDominicanDutchDutch West IndianEastern EuropeanEcuadorianEgyptianEnglishEstonianEthiopianEuropeanFijianFilipinoFinnishFrenchFrench American IndianFrench CanadianGermanGerman RussianGhanaianGreekGuamanian/ChamorroGuatemalanGuyaneseHaitianHmongHonduranHopiHoumaHungarianIcelanderIndian (Asian)IndonesianInupiatIranianIraqiIrishIroquoisIsraeliItalianJamaicanJapaneseJordanianKenyanKiowaKoreanLaotianLatvianLebaneseLiberianLithuanianLumbeeLuxembourgerMacedonianMalaysianMalteseMarshalleseMenomineeMexicanMexican American IndianMongolianMoroccanNative HawaiianNavajoNepaleseNew ZealanderNicaraguanNigerianNorthern EuropeanNorwegianOkinawanOsageOttawaPaiutePakistaniPalestinianPanamanianParaguayanPennsylvania GermanPeruvianPimaPolishPortuguesePotawatomiPuebloPuerto RicanPuget Sound SalishRomanianRussianSalvadoranSamoanScandinavianScotch-IrishScottishSeminoleSenegaleseSerbianShoshoneSierra LeoneanSiouxSlavicSlovakSloveneSomaliSouth AfricanSouth AmericanSouth American IndianSoviet UnionSpaniardSpanishSpanish AmericanSpanish American IndianSri LankanSubsaharan AfricanSudaneseSwedishSwissSyrianTaiwaneseThaiTlingit-HaidaTohono O'OdhamTonganTrinidadian and TobagonianTsimshianTurkishU.S. Virgin IslanderUgandanUkrainianUruguayanUteVenezuelanVietnameseWelshWest IndianYakamaYaquiYugoslavianYumanYup'ikZimbabwean
Immigration
NonimmigrantsImmigrantsAfghanistanAfricaAlbaniaArgentinaArmeniaAsiaAustraliaAustriaBahamasBangladeshBarbadosBelarusBelgiumBelizeBoliviaBosnia and HerzegovinaBrazilBulgariaBurma/MyanmarCabo VerdeCambodiaCameroonCanadaCaribbeanCentral AmericaChileChinaColombiaCongoCosta RicaCroatiaCubaCzechoslovakiaDenmarkDominicaDominican RepublicEastern AfricaEastern AsiaEastern EuropeEcuadorEgyptEl SalvadorEnglandEritreaEthiopiaEuropeFijiFranceGermanyGhanaGreeceGrenadaGuatemalaGuyanaHaitiHondurasHong KongHungaryIndiaIndonesiaIranIraqIsraelItalyJamaicaJapanJordanKazakhstanKenyaKoreaKuwaitLaosLatin AmericaLatviaLebanonLiberiaLithuaniaMalaysiaMexicoMicronesiaMiddle AfricaMoldovaMoroccoNepalNetherlandsNicaraguaNigeriaNorth AmericaNorth MacedoniaNorthern AfricaNorthern EuropeNorwayOceaniaPakistanPanamaPeruPhilippinesPolandPortugalRomaniaRussiaSaudi ArabiaScotlandSenegalSerbiaSierra LeoneSingaporeSomaliaSouth AfricaSouth AmericaSouth Central AsiaSouth Eastern AsiaSouthern EuropeSpainSri LankaSt. Vincent and the GrenadinesSudanSwedenSwitzerlandSyriaTaiwanThailandTrinidad and TobagoTurkeyUgandaUkraineUruguayUzbekistanVenezuelaVietnamWest IndiesWestern AfricaWestern AsiaWestern EuropeYemenZaireZimbabweAzores
High School Diploma
Income
Poverty
Unemployment
Labor Participation
Family Structure
Vehicle Availability
Education Level
Disability

High School Diploma Comparison

Immigrants from Ireland

Immigrants from South Central Asia

Exceptional
Exceptional
91.3%
HIGH SCHOOL DIPLOMA
99.9/ 100
METRIC RATING
37th/ 347
METRIC RANK
90.9%
HIGH SCHOOL DIPLOMA
99.4/ 100
METRIC RATING
73rd/ 347
METRIC RANK

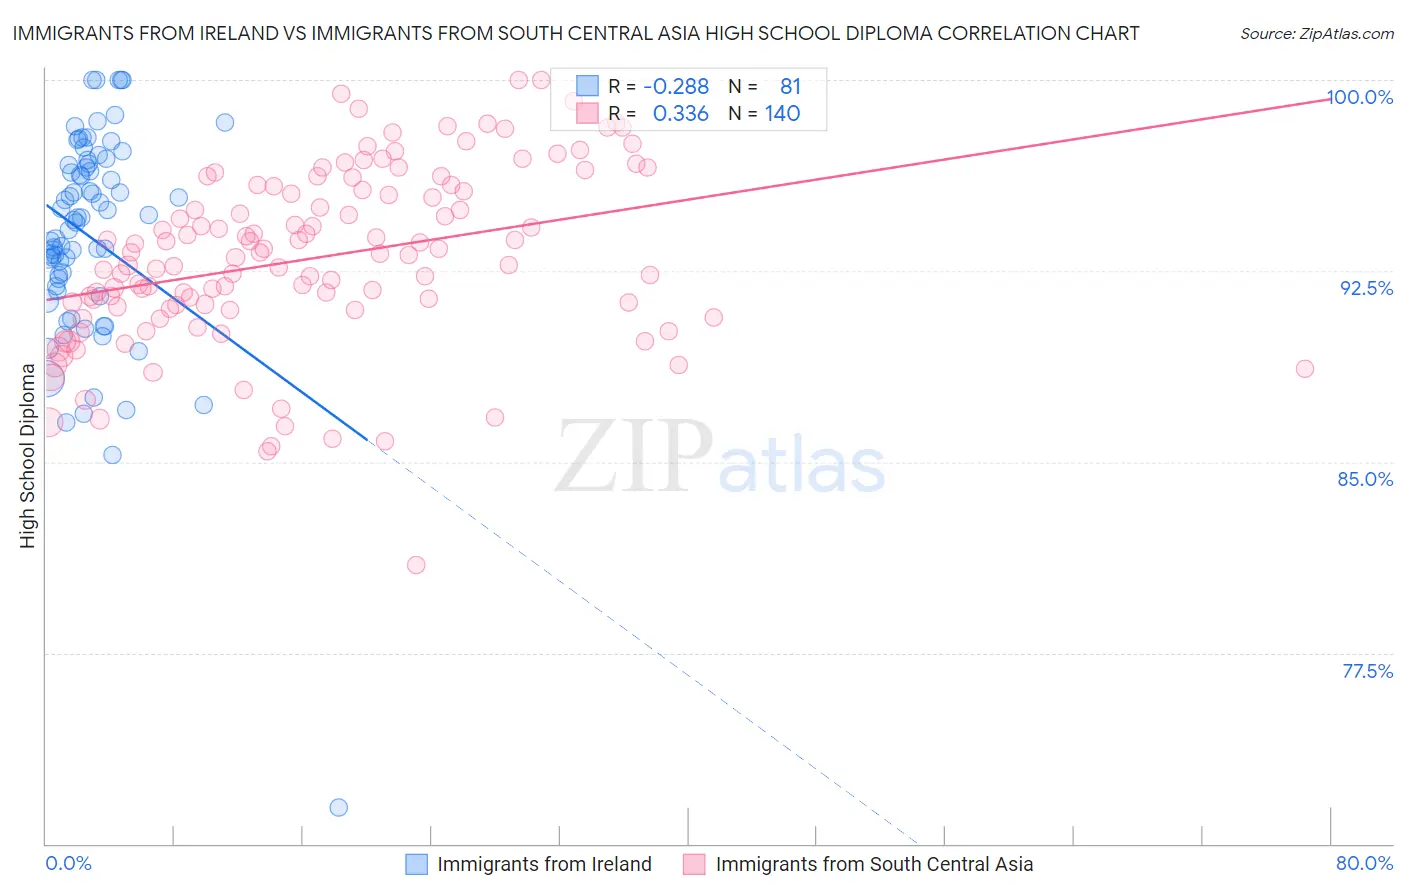
Immigrants from Ireland vs Immigrants from South Central Asia High School Diploma Correlation Chart

The statistical analysis conducted on geographies consisting of 240,784,498 people shows a weak negative correlation between the proportion of Immigrants from Ireland and percentage of population with at least high school diploma education in the United States with a correlation coefficient (R) of -0.288 and weighted average of 91.3%. Similarly, the statistical analysis conducted on geographies consisting of 473,113,181 people shows a mild positive correlation between the proportion of Immigrants from South Central Asia and percentage of population with at least high school diploma education in the United States with a correlation coefficient (R) of 0.336 and weighted average of 90.9%, a difference of 0.52%.
Immigrants from Ireland vs Immigrants from South Central Asia High School Diploma

High School Diploma Correlation Summary

MeasurementImmigrants from IrelandImmigrants from South Central Asia
Minimum71.4%80.9%
Maximum100.0%100.0%
Range28.6%19.1%
Mean93.8%93.0%
Median94.5%93.2%
Interquartile 25% (IQ1)91.8%91.1%
Interquartile 75% (IQ3)96.7%95.8%
Interquartile Range (IQR)4.9%4.7%
Standard Deviation (Sample)4.3%3.5%
Standard Deviation (Population)4.3%3.5%

Similar Demographics by High School Diploma

Demographics Similar to Immigrants from Ireland by High School Diploma

In terms of high school diploma, the demographic groups most similar to Immigrants from Ireland are Tsimshian (91.3%, a difference of 0.020%), Immigrants from Scotland (91.3%, a difference of 0.020%), Dutch (91.3%, a difference of 0.040%), Immigrants from Lithuania (91.3%, a difference of 0.040%), and Irish (91.4%, a difference of 0.050%).
DemographicsRating | RankHigh School Diploma
Iranians
99.9
/100
|
#30
Exceptional
91.4%
Immigrants | Northern Europe
99.9
/100
|
#31
Exceptional
91.4%
English
99.9
/100
|
#32
Exceptional
91.4%
Okinawans
99.9
/100
|
#33
Exceptional
91.4%
Scottish
99.9
/100
|
#34
Exceptional
91.4%
Irish
99.9
/100
|
#35
Exceptional
91.4%
Tsimshian
99.9
/100
|
#36
Exceptional
91.3%
Immigrants | Ireland
99.9
/100
|
#37
Exceptional
91.3%
Immigrants | Scotland
99.8
/100
|
#38
Exceptional
91.3%
Dutch
99.8
/100
|
#39
Exceptional
91.3%
Immigrants | Lithuania
99.8
/100
|
#40
Exceptional
91.3%
Immigrants | Australia
99.8
/100
|
#41
Exceptional
91.3%
Northern Europeans
99.8
/100
|
#42
Exceptional
91.3%
British
99.8
/100
|
#43
Exceptional
91.3%
Immigrants | Austria
99.8
/100
|
#44
Exceptional
91.3%

Demographics Similar to Immigrants from South Central Asia by High School Diploma

In terms of high school diploma, the demographic groups most similar to Immigrants from South Central Asia are Immigrants from Czechoslovakia (90.9%, a difference of 0.010%), Cambodian (90.8%, a difference of 0.020%), Immigrants from Latvia (90.9%, a difference of 0.030%), Alaskan Athabascan (90.9%, a difference of 0.030%), and Soviet Union (90.9%, a difference of 0.030%).
DemographicsRating | RankHigh School Diploma
French
99.5
/100
|
#66
Exceptional
91.0%
Immigrants | Iran
99.5
/100
|
#67
Exceptional
90.9%
Czechoslovakians
99.5
/100
|
#68
Exceptional
90.9%
French Canadians
99.5
/100
|
#69
Exceptional
90.9%
Immigrants | Latvia
99.5
/100
|
#70
Exceptional
90.9%
Alaskan Athabascans
99.4
/100
|
#71
Exceptional
90.9%
Soviet Union
99.4
/100
|
#72
Exceptional
90.9%
Immigrants | South Central Asia
99.4
/100
|
#73
Exceptional
90.9%
Immigrants | Czechoslovakia
99.4
/100
|
#74
Exceptional
90.9%
Cambodians
99.4
/100
|
#75
Exceptional
90.8%
Hungarians
99.3
/100
|
#76
Exceptional
90.8%
Native Hawaiians
99.3
/100
|
#77
Exceptional
90.8%
Burmese
99.3
/100
|
#78
Exceptional
90.8%
Immigrants | Denmark
99.3
/100
|
#79
Exceptional
90.8%
Immigrants | England
99.3
/100
|
#80
Exceptional
90.8%