Immigrants from Ireland vs Immigrants from Portugal Associate's Degree

COMPARE

Immigrants from Ireland
Race
Ancestry
AfghanAfricanAlaska NativeAlaskan AthabascanAlbanianAleutAlsatianAmericanApacheArabArapahoArgentineanArmenianAssyrian/Chaldean/SyriacAustralianAustrianBahamianBangladeshiBarbadianBasqueBelgianBelizeanBermudanBhutaneseBlackfeetBolivianBrazilianBritishBritish West IndianBulgarianBurmeseCajunCambodianCanadianCape VerdeanCarpatho RusynCelticCentral AmericanCentral American IndianCherokeeCheyenneChickasawChileanChineseChippewaChoctawColombianColvilleComancheCosta RicanCreeCreekCroatianCrowCubanCypriotCzechCzechoslovakianDanishDelawareDominicanDutchDutch West IndianEastern EuropeanEcuadorianEgyptianEnglishEstonianEthiopianEuropeanFijianFilipinoFinnishFrenchFrench American IndianFrench CanadianGermanGerman RussianGhanaianGreekGuamanian/ChamorroGuatemalanGuyaneseHaitianHmongHonduranHopiHoumaHungarianIcelanderIndian (Asian)IndonesianInupiatIranianIraqiIrishIroquoisIsraeliItalianJamaicanJapaneseJordanianKenyanKiowaKoreanLaotianLatvianLebaneseLiberianLithuanianLumbeeLuxembourgerMacedonianMalaysianMalteseMarshalleseMenomineeMexicanMexican American IndianMongolianMoroccanNative HawaiianNavajoNepaleseNew ZealanderNicaraguanNigerianNorthern EuropeanNorwegianOkinawanOsageOttawaPaiutePakistaniPalestinianPanamanianParaguayanPennsylvania GermanPeruvianPimaPolishPortuguesePotawatomiPuebloPuerto RicanPuget Sound SalishRomanianRussianSalvadoranSamoanScandinavianScotch-IrishScottishSeminoleSenegaleseSerbianShoshoneSierra LeoneanSiouxSlavicSlovakSloveneSomaliSouth AfricanSouth AmericanSouth American IndianSoviet UnionSpaniardSpanishSpanish AmericanSpanish American IndianSri LankanSubsaharan AfricanSudaneseSwedishSwissSyrianTaiwaneseThaiTlingit-HaidaTohono O'OdhamTonganTrinidadian and TobagonianTsimshianTurkishU.S. Virgin IslanderUgandanUkrainianUruguayanUteVenezuelanVietnameseWelshWest IndianYakamaYaquiYugoslavianYumanYup'ikZimbabwean
Immigration
NonimmigrantsImmigrantsAfghanistanAfricaAlbaniaArgentinaArmeniaAsiaAustraliaAustriaBahamasBangladeshBarbadosBelarusBelgiumBelizeBoliviaBosnia and HerzegovinaBrazilBulgariaBurma/MyanmarCabo VerdeCambodiaCameroonCanadaCaribbeanCentral AmericaChileChinaColombiaCongoCosta RicaCroatiaCubaCzechoslovakiaDenmarkDominicaDominican RepublicEastern AfricaEastern AsiaEastern EuropeEcuadorEgyptEl SalvadorEnglandEritreaEthiopiaEuropeFijiFranceGermanyGhanaGreeceGrenadaGuatemalaGuyanaHaitiHondurasHong KongHungaryIndiaIndonesiaIranIraqIrelandIsraelItalyJamaicaJapanJordanKazakhstanKenyaKoreaKuwaitLaosLatin AmericaLatviaLebanonLiberiaLithuaniaMalaysiaMexicoMicronesiaMiddle AfricaMoldovaMoroccoNepalNetherlandsNicaraguaNigeriaNorth AmericaNorth MacedoniaNorthern AfricaNorthern EuropeNorwayOceaniaPakistanPanamaPeruPhilippinesPolandRomaniaRussiaSaudi ArabiaScotlandSenegalSerbiaSierra LeoneSingaporeSomaliaSouth AfricaSouth AmericaSouth Central AsiaSouth Eastern AsiaSouthern EuropeSpainSri LankaSt. Vincent and the GrenadinesSudanSwedenSwitzerlandSyriaTaiwanThailandTrinidad and TobagoTurkeyUgandaUkraineUruguayUzbekistanVenezuelaVietnamWest IndiesWestern AfricaWestern AsiaWestern EuropeYemenZaireZimbabweAzores
Immigrants from Portugal
Race
Ancestry
AfghanAfricanAlaska NativeAlaskan AthabascanAlbanianAleutAlsatianAmericanApacheArabArapahoArgentineanArmenianAssyrian/Chaldean/SyriacAustralianAustrianBahamianBangladeshiBarbadianBasqueBelgianBelizeanBermudanBhutaneseBlackfeetBolivianBrazilianBritishBritish West IndianBulgarianBurmeseCajunCambodianCanadianCape VerdeanCarpatho RusynCelticCentral AmericanCentral American IndianCherokeeCheyenneChickasawChileanChineseChippewaChoctawColombianColvilleComancheCosta RicanCreeCreekCroatianCrowCubanCypriotCzechCzechoslovakianDanishDelawareDominicanDutchDutch West IndianEastern EuropeanEcuadorianEgyptianEnglishEstonianEthiopianEuropeanFijianFilipinoFinnishFrenchFrench American IndianFrench CanadianGermanGerman RussianGhanaianGreekGuamanian/ChamorroGuatemalanGuyaneseHaitianHmongHonduranHopiHoumaHungarianIcelanderIndian (Asian)IndonesianInupiatIranianIraqiIrishIroquoisIsraeliItalianJamaicanJapaneseJordanianKenyanKiowaKoreanLaotianLatvianLebaneseLiberianLithuanianLumbeeLuxembourgerMacedonianMalaysianMalteseMarshalleseMenomineeMexicanMexican American IndianMongolianMoroccanNative HawaiianNavajoNepaleseNew ZealanderNicaraguanNigerianNorthern EuropeanNorwegianOkinawanOsageOttawaPaiutePakistaniPalestinianPanamanianParaguayanPennsylvania GermanPeruvianPimaPolishPortuguesePotawatomiPuebloPuerto RicanPuget Sound SalishRomanianRussianSalvadoranSamoanScandinavianScotch-IrishScottishSeminoleSenegaleseSerbianShoshoneSierra LeoneanSiouxSlavicSlovakSloveneSomaliSouth AfricanSouth AmericanSouth American IndianSoviet UnionSpaniardSpanishSpanish AmericanSpanish American IndianSri LankanSubsaharan AfricanSudaneseSwedishSwissSyrianTaiwaneseThaiTlingit-HaidaTohono O'OdhamTonganTrinidadian and TobagonianTsimshianTurkishU.S. Virgin IslanderUgandanUkrainianUruguayanUteVenezuelanVietnameseWelshWest IndianYakamaYaquiYugoslavianYumanYup'ikZimbabwean
Immigration
NonimmigrantsImmigrantsAfghanistanAfricaAlbaniaArgentinaArmeniaAsiaAustraliaAustriaBahamasBangladeshBarbadosBelarusBelgiumBelizeBoliviaBosnia and HerzegovinaBrazilBulgariaBurma/MyanmarCabo VerdeCambodiaCameroonCanadaCaribbeanCentral AmericaChileChinaColombiaCongoCosta RicaCroatiaCubaCzechoslovakiaDenmarkDominicaDominican RepublicEastern AfricaEastern AsiaEastern EuropeEcuadorEgyptEl SalvadorEnglandEritreaEthiopiaEuropeFijiFranceGermanyGhanaGreeceGrenadaGuatemalaGuyanaHaitiHondurasHong KongHungaryIndiaIndonesiaIranIraqIsraelItalyJamaicaJapanJordanKazakhstanKenyaKoreaKuwaitLaosLatin AmericaLatviaLebanonLiberiaLithuaniaMalaysiaMexicoMicronesiaMiddle AfricaMoldovaMoroccoNepalNetherlandsNicaraguaNigeriaNorth AmericaNorth MacedoniaNorthern AfricaNorthern EuropeNorwayOceaniaPakistanPanamaPeruPhilippinesPolandPortugalRomaniaRussiaSaudi ArabiaScotlandSenegalSerbiaSierra LeoneSingaporeSomaliaSouth AfricaSouth AmericaSouth Central AsiaSouth Eastern AsiaSouthern EuropeSpainSri LankaSt. Vincent and the GrenadinesSudanSwedenSwitzerlandSyriaTaiwanThailandTrinidad and TobagoTurkeyUgandaUkraineUruguayUzbekistanVenezuelaVietnamWest IndiesWestern AfricaWestern AsiaWestern EuropeYemenZaireZimbabweAzores
Associate's Degree
Income
Poverty
Unemployment
Labor Participation
Family Structure
Vehicle Availability
Education Level
Disability

Associate's Degree Comparison

Immigrants from Ireland

Immigrants from Portugal

Exceptional
Tragic
54.7%
ASSOCIATE'S DEGREE
100.0/ 100
METRIC RATING
19th/ 347
METRIC RANK
40.1%
ASSOCIATE'S DEGREE
0.1/ 100
METRIC RATING
281st/ 347
METRIC RANK

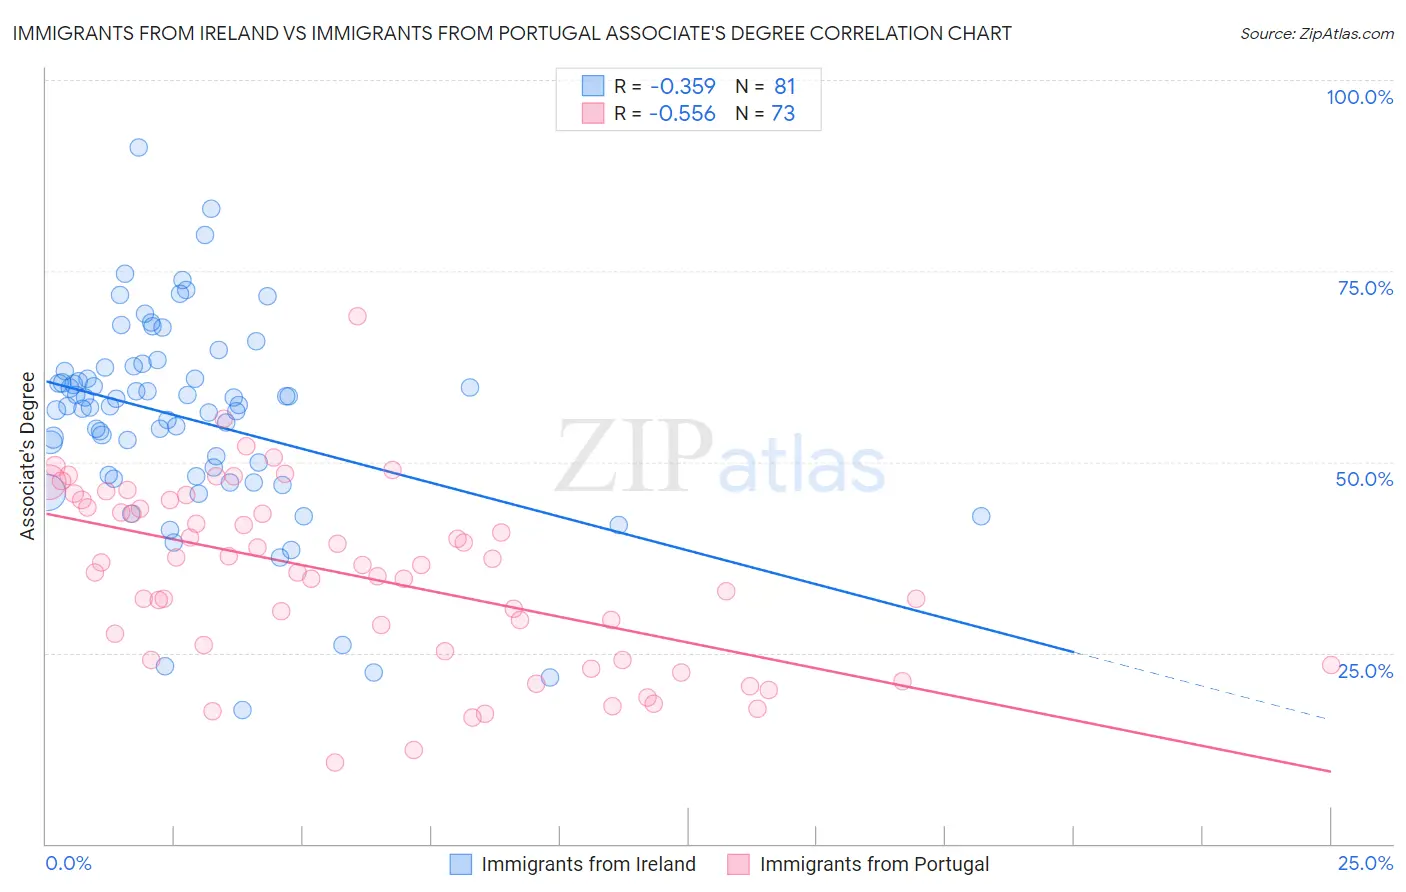
Immigrants from Ireland vs Immigrants from Portugal Associate's Degree Correlation Chart

The statistical analysis conducted on geographies consisting of 240,784,302 people shows a mild negative correlation between the proportion of Immigrants from Ireland and percentage of population with at least associate's degree education in the United States with a correlation coefficient (R) of -0.359 and weighted average of 54.7%. Similarly, the statistical analysis conducted on geographies consisting of 174,792,107 people shows a substantial negative correlation between the proportion of Immigrants from Portugal and percentage of population with at least associate's degree education in the United States with a correlation coefficient (R) of -0.556 and weighted average of 40.1%, a difference of 36.1%.
Immigrants from Ireland vs Immigrants from Portugal Associate's Degree

Associate's Degree Correlation Summary

MeasurementImmigrants from IrelandImmigrants from Portugal
Minimum17.6%10.6%
Maximum91.2%69.0%
Range73.6%58.4%
Mean55.6%35.1%
Median57.4%36.6%
Interquartile 25% (IQ1)48.2%24.6%
Interquartile 75% (IQ3)62.1%44.5%
Interquartile Range (IQR)13.9%19.9%
Standard Deviation (Sample)13.2%11.8%
Standard Deviation (Population)13.1%11.7%

Similar Demographics by Associate's Degree

Demographics Similar to Immigrants from Ireland by Associate's Degree

In terms of associate's degree, the demographic groups most similar to Immigrants from Ireland are Cambodian (54.6%, a difference of 0.020%), Immigrants from Sweden (54.6%, a difference of 0.090%), Immigrants from Japan (54.6%, a difference of 0.12%), Burmese (54.6%, a difference of 0.12%), and Immigrants from Korea (54.5%, a difference of 0.21%).
DemographicsRating | RankAssociate's Degree
Immigrants | South Central Asia
100.0
/100
|
#12
Exceptional
55.7%
Immigrants | China
100.0
/100
|
#13
Exceptional
55.5%
Immigrants | Hong Kong
100.0
/100
|
#14
Exceptional
55.4%
Immigrants | Eastern Asia
100.0
/100
|
#15
Exceptional
55.4%
Soviet Union
100.0
/100
|
#16
Exceptional
55.1%
Eastern Europeans
100.0
/100
|
#17
Exceptional
55.0%
Indians (Asian)
100.0
/100
|
#18
Exceptional
54.8%
Immigrants | Ireland
100.0
/100
|
#19
Exceptional
54.7%
Cambodians
100.0
/100
|
#20
Exceptional
54.6%
Immigrants | Sweden
100.0
/100
|
#21
Exceptional
54.6%
Immigrants | Japan
100.0
/100
|
#22
Exceptional
54.6%
Burmese
100.0
/100
|
#23
Exceptional
54.6%
Immigrants | Korea
100.0
/100
|
#24
Exceptional
54.5%
Immigrants | Switzerland
100.0
/100
|
#25
Exceptional
54.5%
Immigrants | Belgium
100.0
/100
|
#26
Exceptional
54.5%

Demographics Similar to Immigrants from Portugal by Associate's Degree

In terms of associate's degree, the demographic groups most similar to Immigrants from Portugal are Immigrants from Micronesia (40.2%, a difference of 0.10%), Immigrants from Nicaragua (40.3%, a difference of 0.30%), Bangladeshi (40.0%, a difference of 0.31%), Ottawa (40.3%, a difference of 0.34%), and Haitian (40.0%, a difference of 0.46%).
DemographicsRating | RankAssociate's Degree
Immigrants | Dominica
0.1
/100
|
#274
Tragic
40.5%
Potawatomi
0.1
/100
|
#275
Tragic
40.4%
Puerto Ricans
0.1
/100
|
#276
Tragic
40.4%
Blackfeet
0.1
/100
|
#277
Tragic
40.3%
Ottawa
0.1
/100
|
#278
Tragic
40.3%
Immigrants | Nicaragua
0.1
/100
|
#279
Tragic
40.3%
Immigrants | Micronesia
0.1
/100
|
#280
Tragic
40.2%
Immigrants | Portugal
0.1
/100
|
#281
Tragic
40.1%
Bangladeshis
0.1
/100
|
#282
Tragic
40.0%
Haitians
0.1
/100
|
#283
Tragic
40.0%
Comanche
0.1
/100
|
#284
Tragic
39.9%
Immigrants | Belize
0.1
/100
|
#285
Tragic
39.9%
Immigrants | Caribbean
0.0
/100
|
#286
Tragic
39.7%
Aleuts
0.0
/100
|
#287
Tragic
39.6%
Immigrants | Cuba
0.0
/100
|
#288
Tragic
39.5%