Immigrants from Ireland vs Estonian Doctorate Degree
COMPARE
Immigrants from Ireland
Estonian
Doctorate Degree
Doctorate Degree Comparison
Immigrants from Ireland
Estonians
2.5%
DOCTORATE DEGREE
100.0/ 100
METRIC RATING
39th/ 347
METRIC RANK
2.5%
DOCTORATE DEGREE
100.0/ 100
METRIC RATING
40th/ 347
METRIC RANK
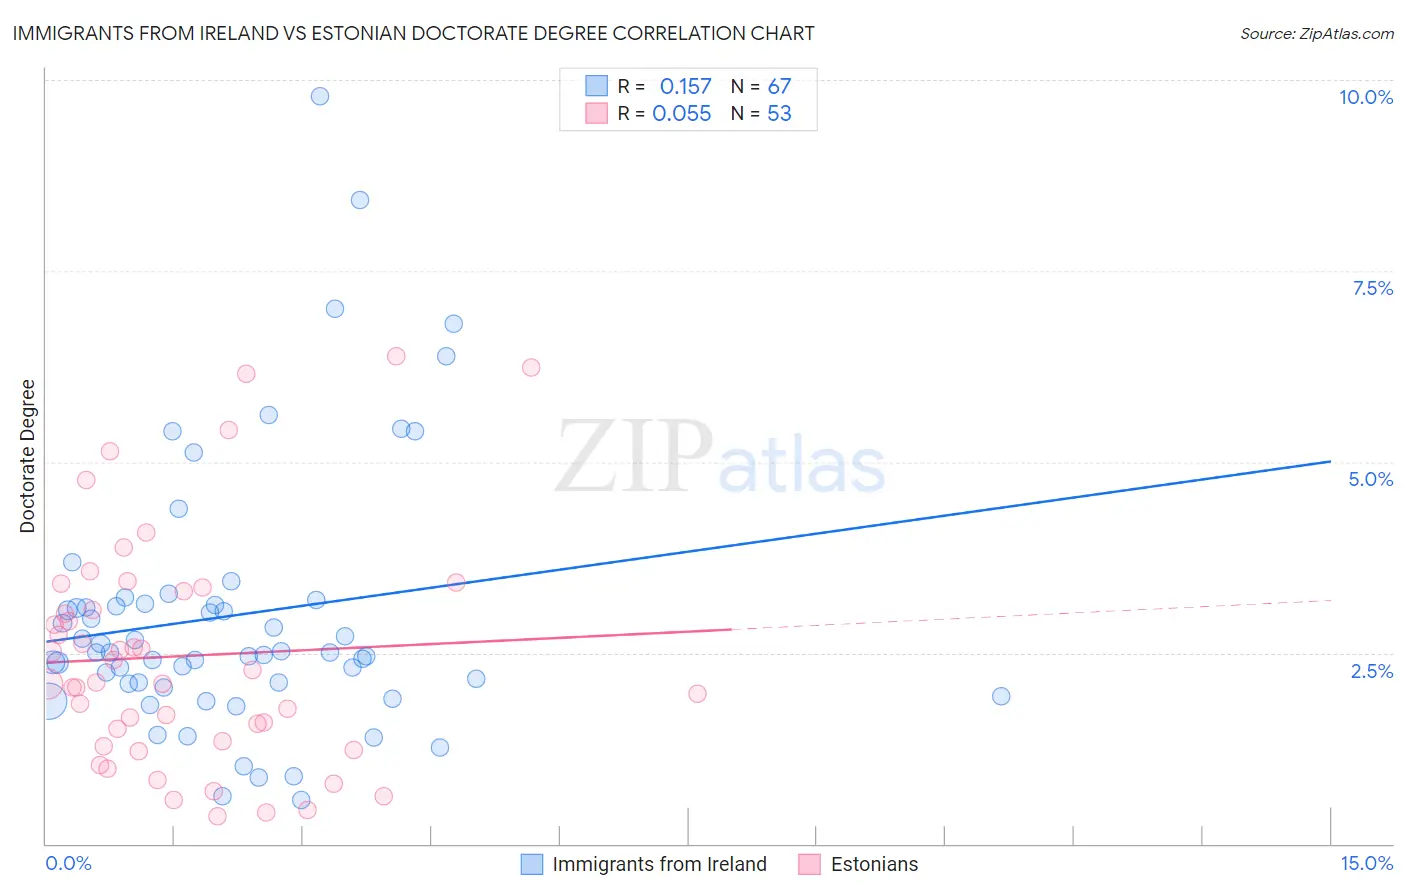
Immigrants from Ireland vs Estonian Doctorate Degree Correlation Chart
The statistical analysis conducted on geographies consisting of 240,028,827 people shows a poor positive correlation between the proportion of Immigrants from Ireland and percentage of population with at least doctorate degree education in the United States with a correlation coefficient (R) of 0.157 and weighted average of 2.5%. Similarly, the statistical analysis conducted on geographies consisting of 123,266,987 people shows a slight positive correlation between the proportion of Estonians and percentage of population with at least doctorate degree education in the United States with a correlation coefficient (R) of 0.055 and weighted average of 2.5%, a difference of 0.41%.
Doctorate Degree Correlation Summary
| Measurement | Immigrants from Ireland | Estonian |
| Minimum | 0.58% | 0.36% |
| Maximum | 9.8% | 6.4% |
| Range | 9.2% | 6.0% |
| Mean | 3.0% | 2.5% |
| Median | 2.5% | 2.1% |
| Interquartile 25% (IQ1) | 2.1% | 1.3% |
| Interquartile 75% (IQ3) | 3.1% | 3.3% |
| Interquartile Range (IQR) | 1.0% | 2.0% |
| Standard Deviation (Sample) | 1.8% | 1.5% |
| Standard Deviation (Population) | 1.7% | 1.5% |
Demographics Similar to Immigrants from Ireland and Estonians by Doctorate Degree
In terms of doctorate degree, the demographic groups most similar to Immigrants from Ireland are Russian (2.6%, a difference of 0.49%), Immigrants from Kuwait (2.6%, a difference of 0.65%), Immigrants from Russia (2.5%, a difference of 0.74%), Immigrants from Spain (2.6%, a difference of 0.92%), and Immigrants from Malaysia (2.6%, a difference of 0.97%). Similarly, the demographic groups most similar to Estonians are Immigrants from Russia (2.5%, a difference of 0.33%), Russian (2.6%, a difference of 0.91%), New Zealander (2.5%, a difference of 0.96%), Immigrants from Kuwait (2.6%, a difference of 1.1%), and Immigrants from Spain (2.6%, a difference of 1.3%).
| Demographics | Rating | Rank | Doctorate Degree |
| Immigrants | South Central Asia | 100.0 /100 | #29 | Exceptional 2.6% |
| Immigrants | Korea | 100.0 /100 | #30 | Exceptional 2.6% |
| Latvians | 100.0 /100 | #31 | Exceptional 2.6% |
| Immigrants | Northern Europe | 100.0 /100 | #32 | Exceptional 2.6% |
| Cambodians | 100.0 /100 | #33 | Exceptional 2.6% |
| Cypriots | 100.0 /100 | #34 | Exceptional 2.6% |
| Immigrants | Malaysia | 100.0 /100 | #35 | Exceptional 2.6% |
| Immigrants | Spain | 100.0 /100 | #36 | Exceptional 2.6% |
| Immigrants | Kuwait | 100.0 /100 | #37 | Exceptional 2.6% |
| Russians | 100.0 /100 | #38 | Exceptional 2.6% |
| Immigrants | Ireland | 100.0 /100 | #39 | Exceptional 2.5% |
| Estonians | 100.0 /100 | #40 | Exceptional 2.5% |
| Immigrants | Russia | 100.0 /100 | #41 | Exceptional 2.5% |
| New Zealanders | 100.0 /100 | #42 | Exceptional 2.5% |
| Soviet Union | 100.0 /100 | #43 | Exceptional 2.5% |
| Immigrants | Netherlands | 100.0 /100 | #44 | Exceptional 2.5% |
| Immigrants | South Africa | 100.0 /100 | #45 | Exceptional 2.4% |
| Immigrants | Austria | 100.0 /100 | #46 | Exceptional 2.4% |
| Immigrants | Western Europe | 100.0 /100 | #47 | Exceptional 2.4% |
| Asians | 100.0 /100 | #48 | Exceptional 2.4% |
| Immigrants | Asia | 100.0 /100 | #49 | Exceptional 2.4% |