Immigrants from Iraq vs Nicaraguan 8th Grade
COMPARE
Immigrants from Iraq
Nicaraguan
8th Grade
8th Grade Comparison
Immigrants from Iraq
Nicaraguans
95.6%
8TH GRADE
36.2/ 100
METRIC RATING
183rd/ 347
METRIC RANK
93.0%
8TH GRADE
0.0/ 100
METRIC RATING
322nd/ 347
METRIC RANK
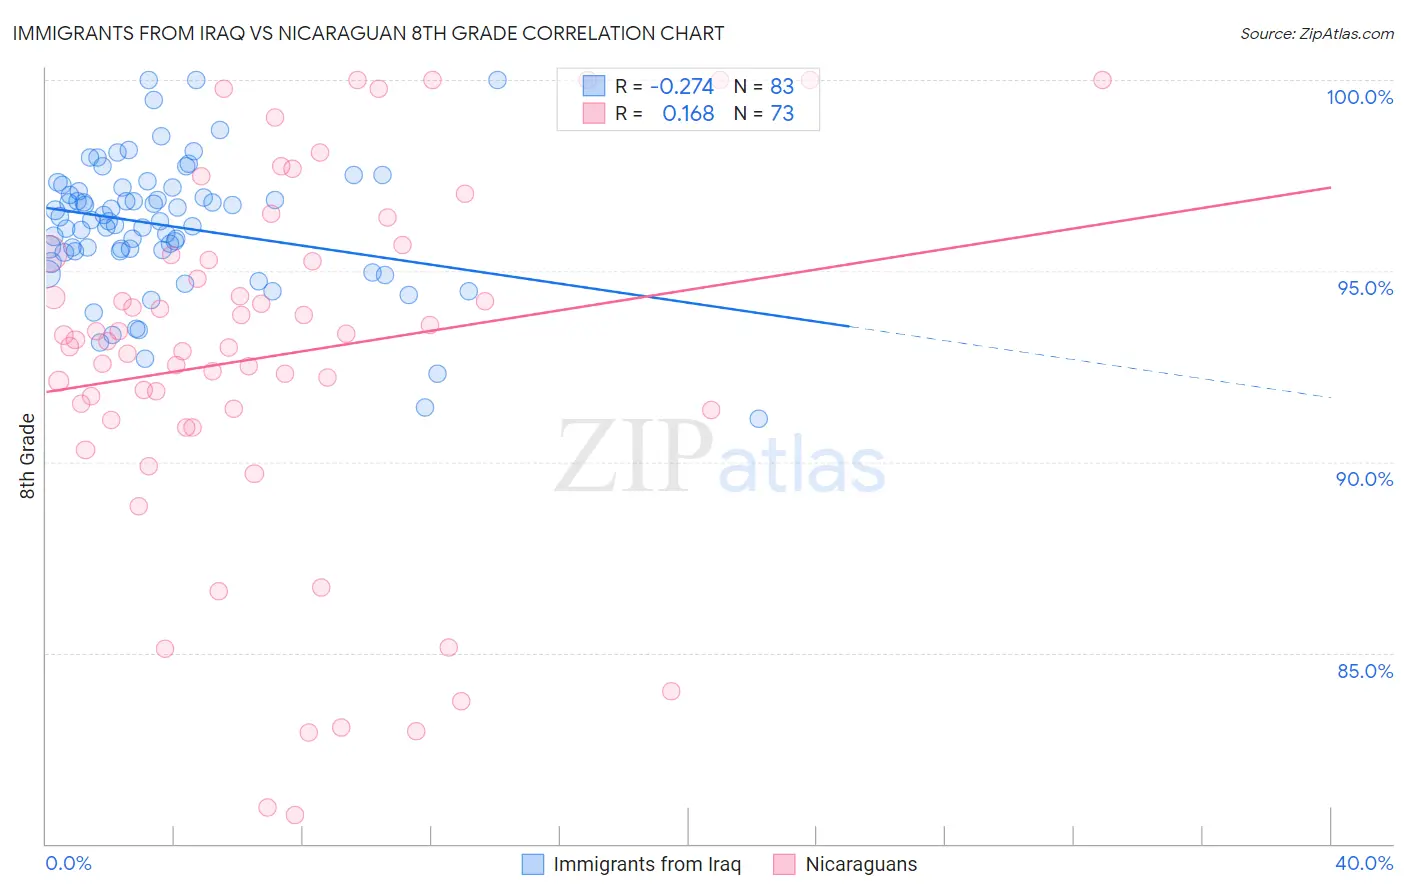
Immigrants from Iraq vs Nicaraguan 8th Grade Correlation Chart
The statistical analysis conducted on geographies consisting of 194,632,332 people shows a weak negative correlation between the proportion of Immigrants from Iraq and percentage of population with at least 8th grade education in the United States with a correlation coefficient (R) of -0.274 and weighted average of 95.6%. Similarly, the statistical analysis conducted on geographies consisting of 285,711,651 people shows a poor positive correlation between the proportion of Nicaraguans and percentage of population with at least 8th grade education in the United States with a correlation coefficient (R) of 0.168 and weighted average of 93.0%, a difference of 2.9%.
8th Grade Correlation Summary
| Measurement | Immigrants from Iraq | Nicaraguan |
| Minimum | 91.1% | 80.8% |
| Maximum | 100.0% | 100.0% |
| Range | 8.9% | 19.2% |
| Mean | 96.2% | 92.8% |
| Median | 96.3% | 93.2% |
| Interquartile 25% (IQ1) | 95.5% | 91.2% |
| Interquartile 75% (IQ3) | 97.2% | 95.4% |
| Interquartile Range (IQR) | 1.7% | 4.2% |
| Standard Deviation (Sample) | 1.7% | 4.8% |
| Standard Deviation (Population) | 1.7% | 4.7% |
Similar Demographics by 8th Grade
Demographics Similar to Immigrants from Iraq by 8th Grade
In terms of 8th grade, the demographic groups most similar to Immigrants from Iraq are Immigrants from Uganda (95.6%, a difference of 0.0%), Immigrants from Egypt (95.7%, a difference of 0.010%), Black/African American (95.6%, a difference of 0.010%), Brazilian (95.6%, a difference of 0.010%), and Immigrants from Spain (95.7%, a difference of 0.020%).
| Demographics | Rating | Rank | 8th Grade |
| Pakistanis | 48.8 /100 | #176 | Average 95.7% |
| Marshallese | 47.6 /100 | #177 | Average 95.7% |
| Venezuelans | 47.5 /100 | #178 | Average 95.7% |
| Immigrants | Brazil | 45.4 /100 | #179 | Average 95.7% |
| Iraqis | 40.5 /100 | #180 | Average 95.7% |
| Immigrants | Spain | 38.7 /100 | #181 | Fair 95.7% |
| Immigrants | Egypt | 37.9 /100 | #182 | Fair 95.7% |
| Immigrants | Iraq | 36.2 /100 | #183 | Fair 95.6% |
| Immigrants | Uganda | 36.0 /100 | #184 | Fair 95.6% |
| Blacks/African Americans | 34.8 /100 | #185 | Fair 95.6% |
| Brazilians | 34.8 /100 | #186 | Fair 95.6% |
| Sudanese | 33.0 /100 | #187 | Fair 95.6% |
| Liberians | 32.4 /100 | #188 | Fair 95.6% |
| Immigrants | Micronesia | 31.6 /100 | #189 | Fair 95.6% |
| Immigrants | Venezuela | 30.8 /100 | #190 | Fair 95.6% |
Demographics Similar to Nicaraguans by 8th Grade
In terms of 8th grade, the demographic groups most similar to Nicaraguans are Immigrants from Belize (92.9%, a difference of 0.050%), Belizean (93.1%, a difference of 0.12%), Nepalese (92.8%, a difference of 0.12%), Dominican (92.8%, a difference of 0.22%), and Immigrants from Fiji (93.2%, a difference of 0.25%).
| Demographics | Rating | Rank | 8th Grade |
| Vietnamese | 0.0 /100 | #315 | Tragic 93.5% |
| Immigrants | Cambodia | 0.0 /100 | #316 | Tragic 93.3% |
| Immigrants | Ecuador | 0.0 /100 | #317 | Tragic 93.3% |
| Puerto Ricans | 0.0 /100 | #318 | Tragic 93.2% |
| Immigrants | Cuba | 0.0 /100 | #319 | Tragic 93.2% |
| Immigrants | Fiji | 0.0 /100 | #320 | Tragic 93.2% |
| Belizeans | 0.0 /100 | #321 | Tragic 93.1% |
| Nicaraguans | 0.0 /100 | #322 | Tragic 93.0% |
| Immigrants | Belize | 0.0 /100 | #323 | Tragic 92.9% |
| Nepalese | 0.0 /100 | #324 | Tragic 92.8% |
| Dominicans | 0.0 /100 | #325 | Tragic 92.8% |
| Central American Indians | 0.0 /100 | #326 | Tragic 92.7% |
| Immigrants | Azores | 0.0 /100 | #327 | Tragic 92.5% |
| Immigrants | Nicaragua | 0.0 /100 | #328 | Tragic 92.5% |
| Immigrants | Cabo Verde | 0.0 /100 | #329 | Tragic 92.4% |