Immigrants from Iraq vs Choctaw Master's Degree
COMPARE
Immigrants from Iraq
Choctaw
Master's Degree
Master's Degree Comparison
Immigrants from Iraq
Choctaw
14.8%
MASTER'S DEGREE
41.3/ 100
METRIC RATING
179th/ 347
METRIC RANK
11.0%
MASTER'S DEGREE
0.0/ 100
METRIC RATING
312th/ 347
METRIC RANK
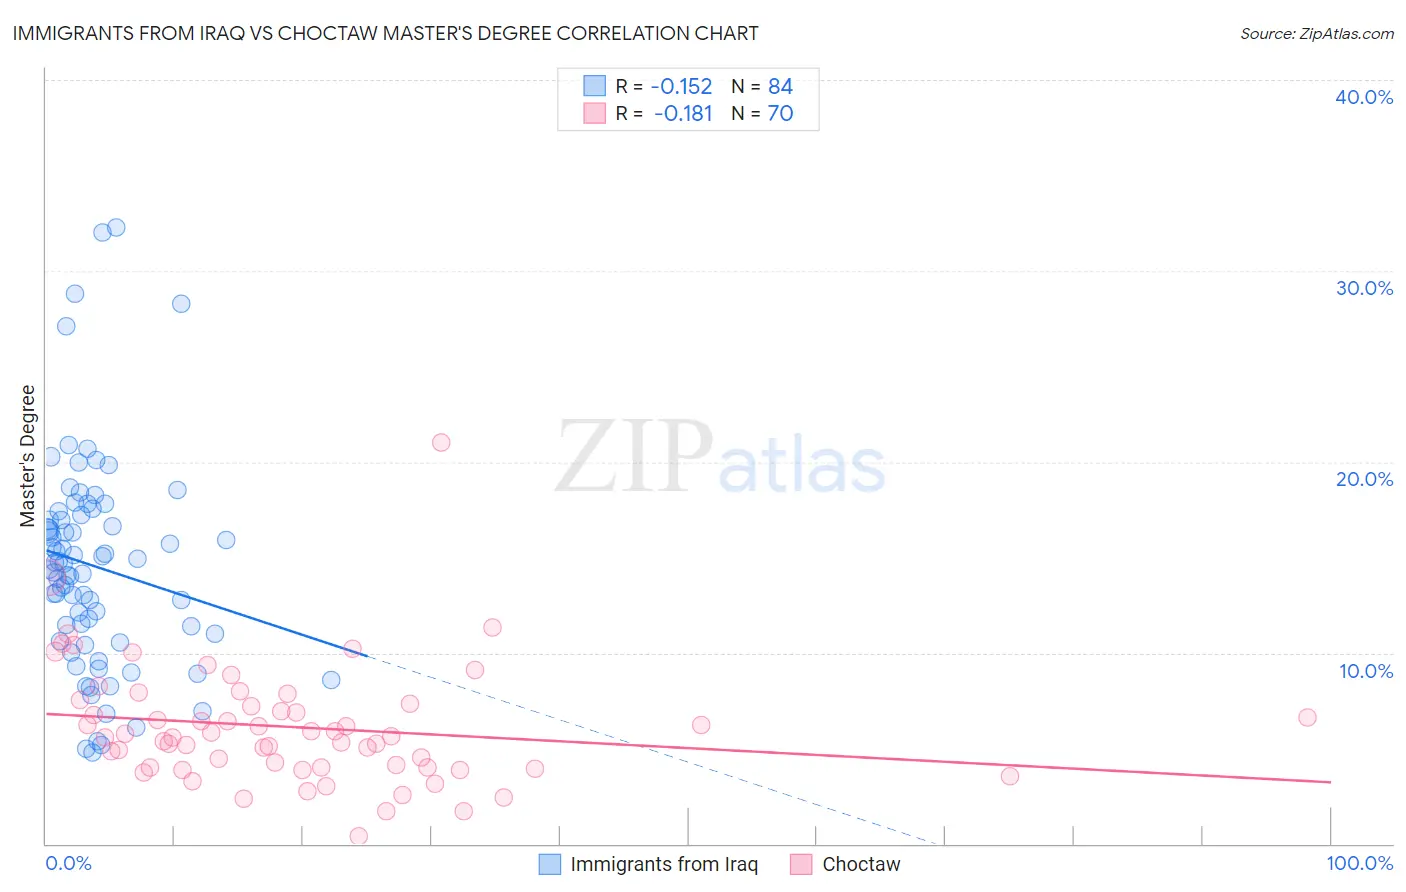
Immigrants from Iraq vs Choctaw Master's Degree Correlation Chart
The statistical analysis conducted on geographies consisting of 194,768,145 people shows a poor negative correlation between the proportion of Immigrants from Iraq and percentage of population with at least master's degree education in the United States with a correlation coefficient (R) of -0.152 and weighted average of 14.8%. Similarly, the statistical analysis conducted on geographies consisting of 269,630,236 people shows a poor negative correlation between the proportion of Choctaw and percentage of population with at least master's degree education in the United States with a correlation coefficient (R) of -0.181 and weighted average of 11.0%, a difference of 33.8%.
Master's Degree Correlation Summary
| Measurement | Immigrants from Iraq | Choctaw |
| Minimum | 4.8% | 0.41% |
| Maximum | 32.3% | 21.0% |
| Range | 27.5% | 20.6% |
| Mean | 14.5% | 6.1% |
| Median | 14.5% | 5.6% |
| Interquartile 25% (IQ1) | 10.8% | 4.0% |
| Interquartile 75% (IQ3) | 17.1% | 7.3% |
| Interquartile Range (IQR) | 6.3% | 3.3% |
| Standard Deviation (Sample) | 5.6% | 3.2% |
| Standard Deviation (Population) | 5.5% | 3.1% |
Similar Demographics by Master's Degree
Demographics Similar to Immigrants from Iraq by Master's Degree
In terms of master's degree, the demographic groups most similar to Immigrants from Iraq are Celtic (14.8%, a difference of 0.010%), Swiss (14.7%, a difference of 0.030%), Czech (14.7%, a difference of 0.13%), Sri Lankan (14.7%, a difference of 0.23%), and Immigrants from Zaire (14.7%, a difference of 0.25%).
| Demographics | Rating | Rank | Master's Degree |
| Immigrants | Uruguay | 52.8 /100 | #172 | Average 15.0% |
| Costa Ricans | 52.5 /100 | #173 | Average 15.0% |
| Slovaks | 50.0 /100 | #174 | Average 14.9% |
| Immigrants | Peru | 49.6 /100 | #175 | Average 14.9% |
| Nigerians | 48.6 /100 | #176 | Average 14.9% |
| Immigrants | Colombia | 48.3 /100 | #177 | Average 14.9% |
| English | 45.0 /100 | #178 | Average 14.8% |
| Immigrants | Iraq | 41.3 /100 | #179 | Average 14.8% |
| Celtics | 41.3 /100 | #180 | Average 14.8% |
| Swiss | 41.1 /100 | #181 | Average 14.7% |
| Czechs | 40.4 /100 | #182 | Average 14.7% |
| Sri Lankans | 39.6 /100 | #183 | Fair 14.7% |
| Immigrants | Zaire | 39.5 /100 | #184 | Fair 14.7% |
| Barbadians | 38.3 /100 | #185 | Fair 14.7% |
| Immigrants | Oceania | 37.1 /100 | #186 | Fair 14.7% |
Demographics Similar to Choctaw by Master's Degree
In terms of master's degree, the demographic groups most similar to Choctaw are Seminole (11.0%, a difference of 0.10%), Yaqui (11.0%, a difference of 0.18%), Cajun (11.0%, a difference of 0.57%), Apache (11.0%, a difference of 0.58%), and Shoshone (11.1%, a difference of 0.61%).
| Demographics | Rating | Rank | Master's Degree |
| Immigrants | Latin America | 0.0 /100 | #305 | Tragic 11.3% |
| Mexican American Indians | 0.0 /100 | #306 | Tragic 11.2% |
| Cheyenne | 0.0 /100 | #307 | Tragic 11.2% |
| Puerto Ricans | 0.0 /100 | #308 | Tragic 11.2% |
| Puget Sound Salish | 0.0 /100 | #309 | Tragic 11.1% |
| Shoshone | 0.0 /100 | #310 | Tragic 11.1% |
| Seminole | 0.0 /100 | #311 | Tragic 11.0% |
| Choctaw | 0.0 /100 | #312 | Tragic 11.0% |
| Yaqui | 0.0 /100 | #313 | Tragic 11.0% |
| Cajuns | 0.0 /100 | #314 | Tragic 11.0% |
| Apache | 0.0 /100 | #315 | Tragic 11.0% |
| Hispanics or Latinos | 0.0 /100 | #316 | Tragic 10.9% |
| Hopi | 0.0 /100 | #317 | Tragic 10.9% |
| Immigrants | Cuba | 0.0 /100 | #318 | Tragic 10.9% |
| Kiowa | 0.0 /100 | #319 | Tragic 10.8% |