Immigrants from Iran vs Immigrants from South Eastern Asia 11th Grade
COMPARE
Immigrants from Iran
Immigrants from South Eastern Asia
11th Grade
11th Grade Comparison
Immigrants from Iran
Immigrants from South Eastern Asia
93.5%
11TH GRADE
98.9/ 100
METRIC RATING
97th/ 347
METRIC RANK
90.9%
11TH GRADE
0.1/ 100
METRIC RATING
275th/ 347
METRIC RANK
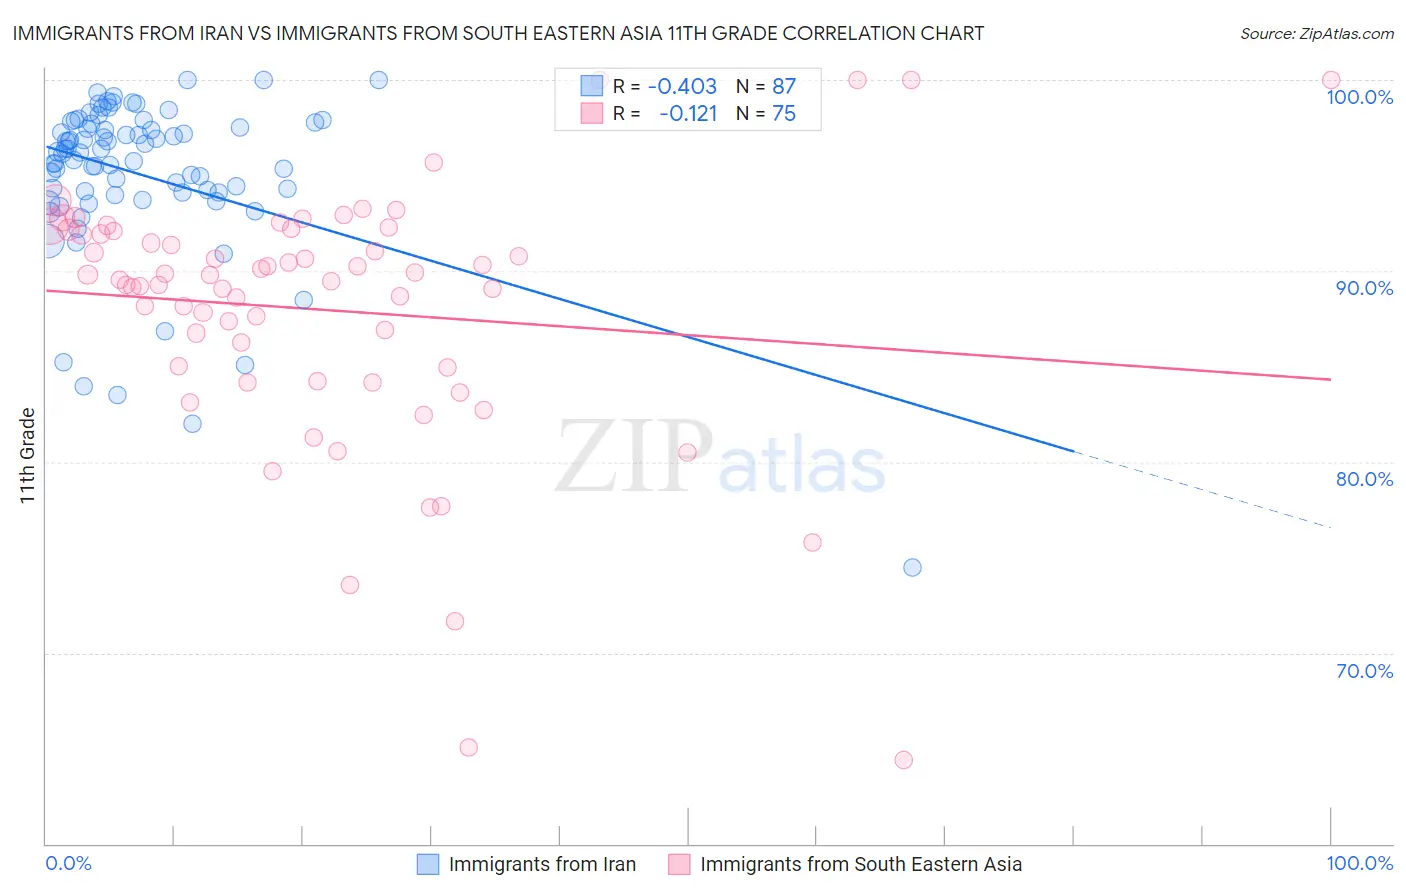
Immigrants from Iran vs Immigrants from South Eastern Asia 11th Grade Correlation Chart
The statistical analysis conducted on geographies consisting of 279,905,207 people shows a moderate negative correlation between the proportion of Immigrants from Iran and percentage of population with at least 11th grade education in the United States with a correlation coefficient (R) of -0.403 and weighted average of 93.5%. Similarly, the statistical analysis conducted on geographies consisting of 512,709,822 people shows a poor negative correlation between the proportion of Immigrants from South Eastern Asia and percentage of population with at least 11th grade education in the United States with a correlation coefficient (R) of -0.121 and weighted average of 90.9%, a difference of 2.9%.
11th Grade Correlation Summary
| Measurement | Immigrants from Iran | Immigrants from South Eastern Asia |
| Minimum | 74.5% | 64.4% |
| Maximum | 100.0% | 100.0% |
| Range | 25.5% | 35.6% |
| Mean | 95.0% | 88.0% |
| Median | 96.2% | 89.5% |
| Interquartile 25% (IQ1) | 94.1% | 85.0% |
| Interquartile 75% (IQ3) | 97.7% | 92.1% |
| Interquartile Range (IQR) | 3.6% | 7.2% |
| Standard Deviation (Sample) | 4.3% | 6.8% |
| Standard Deviation (Population) | 4.3% | 6.7% |
Similar Demographics by 11th Grade
Demographics Similar to Immigrants from Iran by 11th Grade
In terms of 11th grade, the demographic groups most similar to Immigrants from Iran are Immigrants from Turkey (93.5%, a difference of 0.010%), Immigrants from Israel (93.5%, a difference of 0.020%), Menominee (93.5%, a difference of 0.020%), Swiss (93.6%, a difference of 0.030%), and Immigrants from France (93.6%, a difference of 0.030%).
| Demographics | Rating | Rank | 11th Grade |
| Ottawa | 99.2 /100 | #90 | Exceptional 93.6% |
| South Africans | 99.2 /100 | #91 | Exceptional 93.6% |
| Immigrants | Bulgaria | 99.1 /100 | #92 | Exceptional 93.6% |
| Puget Sound Salish | 99.1 /100 | #93 | Exceptional 93.6% |
| Swiss | 99.0 /100 | #94 | Exceptional 93.6% |
| Immigrants | France | 99.0 /100 | #95 | Exceptional 93.6% |
| Immigrants | Turkey | 98.9 /100 | #96 | Exceptional 93.5% |
| Immigrants | Iran | 98.9 /100 | #97 | Exceptional 93.5% |
| Immigrants | Israel | 98.8 /100 | #98 | Exceptional 93.5% |
| Menominee | 98.7 /100 | #99 | Exceptional 93.5% |
| Immigrants | North Macedonia | 98.7 /100 | #100 | Exceptional 93.5% |
| Immigrants | Romania | 98.7 /100 | #101 | Exceptional 93.5% |
| Chippewa | 98.6 /100 | #102 | Exceptional 93.5% |
| Lebanese | 98.6 /100 | #103 | Exceptional 93.5% |
| Immigrants | Europe | 98.6 /100 | #104 | Exceptional 93.5% |
Demographics Similar to Immigrants from South Eastern Asia by 11th Grade
In terms of 11th grade, the demographic groups most similar to Immigrants from South Eastern Asia are Immigrants from Trinidad and Tobago (90.9%, a difference of 0.010%), Paiute (91.0%, a difference of 0.050%), Bangladeshi (90.9%, a difference of 0.070%), Immigrants from Congo (90.9%, a difference of 0.090%), and Immigrants from Peru (91.0%, a difference of 0.10%).
| Demographics | Rating | Rank | 11th Grade |
| U.S. Virgin Islanders | 0.2 /100 | #268 | Tragic 91.1% |
| Ute | 0.2 /100 | #269 | Tragic 91.1% |
| Trinidadians and Tobagonians | 0.2 /100 | #270 | Tragic 91.1% |
| Immigrants | Peru | 0.1 /100 | #271 | Tragic 91.0% |
| West Indians | 0.1 /100 | #272 | Tragic 91.0% |
| Paiute | 0.1 /100 | #273 | Tragic 91.0% |
| Immigrants | Trinidad and Tobago | 0.1 /100 | #274 | Tragic 90.9% |
| Immigrants | South Eastern Asia | 0.1 /100 | #275 | Tragic 90.9% |
| Bangladeshis | 0.1 /100 | #276 | Tragic 90.9% |
| Immigrants | Congo | 0.1 /100 | #277 | Tragic 90.9% |
| Malaysians | 0.1 /100 | #278 | Tragic 90.8% |
| Barbadians | 0.0 /100 | #279 | Tragic 90.8% |
| Sri Lankans | 0.0 /100 | #280 | Tragic 90.7% |
| Dutch West Indians | 0.0 /100 | #281 | Tragic 90.7% |
| Immigrants | St. Vincent and the Grenadines | 0.0 /100 | #282 | Tragic 90.7% |