Immigrants from Iran vs Immigrants from Egypt Master's Degree
COMPARE
Immigrants from Iran
Immigrants from Egypt
Master's Degree
Master's Degree Comparison
Immigrants from Iran
Immigrants from Egypt
21.6%
MASTER'S DEGREE
100.0/ 100
METRIC RATING
10th/ 347
METRIC RANK
17.2%
MASTER'S DEGREE
99.1/ 100
METRIC RATING
90th/ 347
METRIC RANK
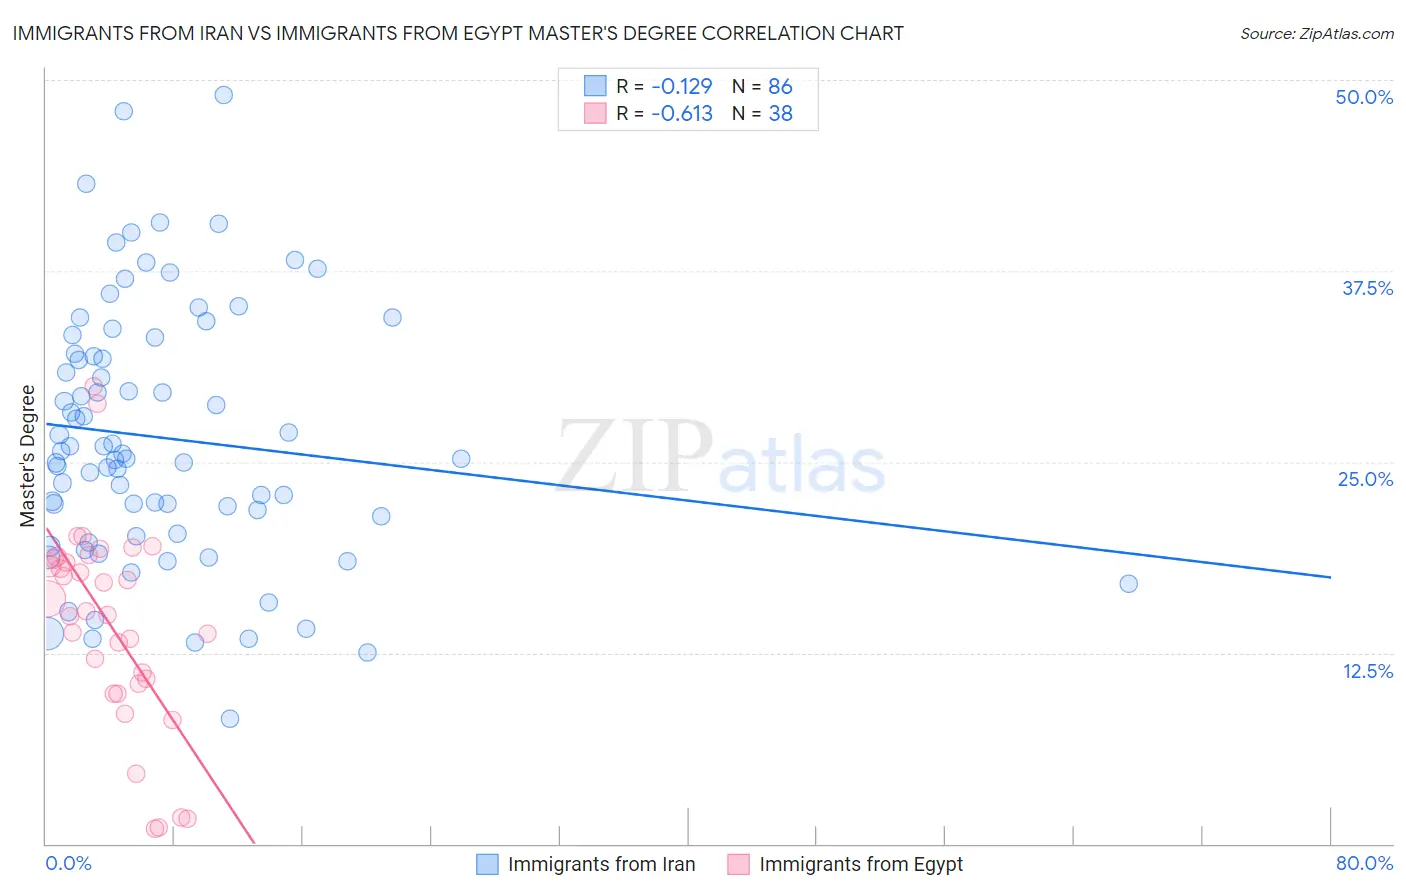
Immigrants from Iran vs Immigrants from Egypt Master's Degree Correlation Chart
The statistical analysis conducted on geographies consisting of 279,879,707 people shows a poor negative correlation between the proportion of Immigrants from Iran and percentage of population with at least master's degree education in the United States with a correlation coefficient (R) of -0.129 and weighted average of 21.6%. Similarly, the statistical analysis conducted on geographies consisting of 245,464,462 people shows a significant negative correlation between the proportion of Immigrants from Egypt and percentage of population with at least master's degree education in the United States with a correlation coefficient (R) of -0.613 and weighted average of 17.2%, a difference of 25.8%.
Master's Degree Correlation Summary
| Measurement | Immigrants from Iran | Immigrants from Egypt |
| Minimum | 8.2% | 1.0% |
| Maximum | 49.0% | 29.9% |
| Range | 40.8% | 28.9% |
| Mean | 26.6% | 14.3% |
| Median | 25.4% | 15.1% |
| Interquartile 25% (IQ1) | 20.3% | 10.4% |
| Interquartile 75% (IQ3) | 32.1% | 18.7% |
| Interquartile Range (IQR) | 11.8% | 8.2% |
| Standard Deviation (Sample) | 8.4% | 6.7% |
| Standard Deviation (Population) | 8.4% | 6.6% |
Similar Demographics by Master's Degree
Demographics Similar to Immigrants from Iran by Master's Degree
In terms of master's degree, the demographic groups most similar to Immigrants from Iran are Thai (21.7%, a difference of 0.41%), Cypriot (21.8%, a difference of 0.75%), Immigrants from China (21.2%, a difference of 2.1%), Eastern European (21.1%, a difference of 2.4%), and Iranian (22.3%, a difference of 3.0%).
| Demographics | Rating | Rank | Master's Degree |
| Immigrants | Israel | 100.0 /100 | #3 | Exceptional 22.6% |
| Okinawans | 100.0 /100 | #4 | Exceptional 22.6% |
| Immigrants | Taiwan | 100.0 /100 | #5 | Exceptional 22.5% |
| Immigrants | India | 100.0 /100 | #6 | Exceptional 22.3% |
| Iranians | 100.0 /100 | #7 | Exceptional 22.3% |
| Cypriots | 100.0 /100 | #8 | Exceptional 21.8% |
| Thais | 100.0 /100 | #9 | Exceptional 21.7% |
| Immigrants | Iran | 100.0 /100 | #10 | Exceptional 21.6% |
| Immigrants | China | 100.0 /100 | #11 | Exceptional 21.2% |
| Eastern Europeans | 100.0 /100 | #12 | Exceptional 21.1% |
| Immigrants | Australia | 100.0 /100 | #13 | Exceptional 20.9% |
| Immigrants | Switzerland | 100.0 /100 | #14 | Exceptional 20.9% |
| Immigrants | Eastern Asia | 100.0 /100 | #15 | Exceptional 20.8% |
| Immigrants | Belgium | 100.0 /100 | #16 | Exceptional 20.8% |
| Immigrants | South Central Asia | 100.0 /100 | #17 | Exceptional 20.7% |
Demographics Similar to Immigrants from Egypt by Master's Degree
In terms of master's degree, the demographic groups most similar to Immigrants from Egypt are Bhutanese (17.2%, a difference of 0.020%), Romanian (17.2%, a difference of 0.070%), Immigrants from Canada (17.2%, a difference of 0.090%), Immigrants from North America (17.2%, a difference of 0.12%), and Immigrants from Italy (17.2%, a difference of 0.18%).
| Demographics | Rating | Rank | Master's Degree |
| Immigrants | Zimbabwe | 99.5 /100 | #83 | Exceptional 17.4% |
| Immigrants | Scotland | 99.4 /100 | #84 | Exceptional 17.4% |
| Immigrants | Brazil | 99.4 /100 | #85 | Exceptional 17.4% |
| Immigrants | Croatia | 99.3 /100 | #86 | Exceptional 17.3% |
| Maltese | 99.3 /100 | #87 | Exceptional 17.3% |
| Immigrants | Canada | 99.2 /100 | #88 | Exceptional 17.2% |
| Bhutanese | 99.1 /100 | #89 | Exceptional 17.2% |
| Immigrants | Egypt | 99.1 /100 | #90 | Exceptional 17.2% |
| Romanians | 99.1 /100 | #91 | Exceptional 17.2% |
| Immigrants | North America | 99.1 /100 | #92 | Exceptional 17.2% |
| Immigrants | Italy | 99.1 /100 | #93 | Exceptional 17.2% |
| Ugandans | 99.0 /100 | #94 | Exceptional 17.1% |
| Immigrants | Morocco | 98.9 /100 | #95 | Exceptional 17.1% |
| Immigrants | Northern Africa | 98.9 /100 | #96 | Exceptional 17.1% |
| Immigrants | England | 98.8 /100 | #97 | Exceptional 17.0% |