Immigrants from Iran vs Croatian 10th Grade
COMPARE
Immigrants from Iran
Croatian
10th Grade
10th Grade Comparison
Immigrants from Iran
Croatians
94.3%
10TH GRADE
94.4/ 100
METRIC RATING
126th/ 347
METRIC RANK
95.7%
10TH GRADE
100.0/ 100
METRIC RATING
10th/ 347
METRIC RANK
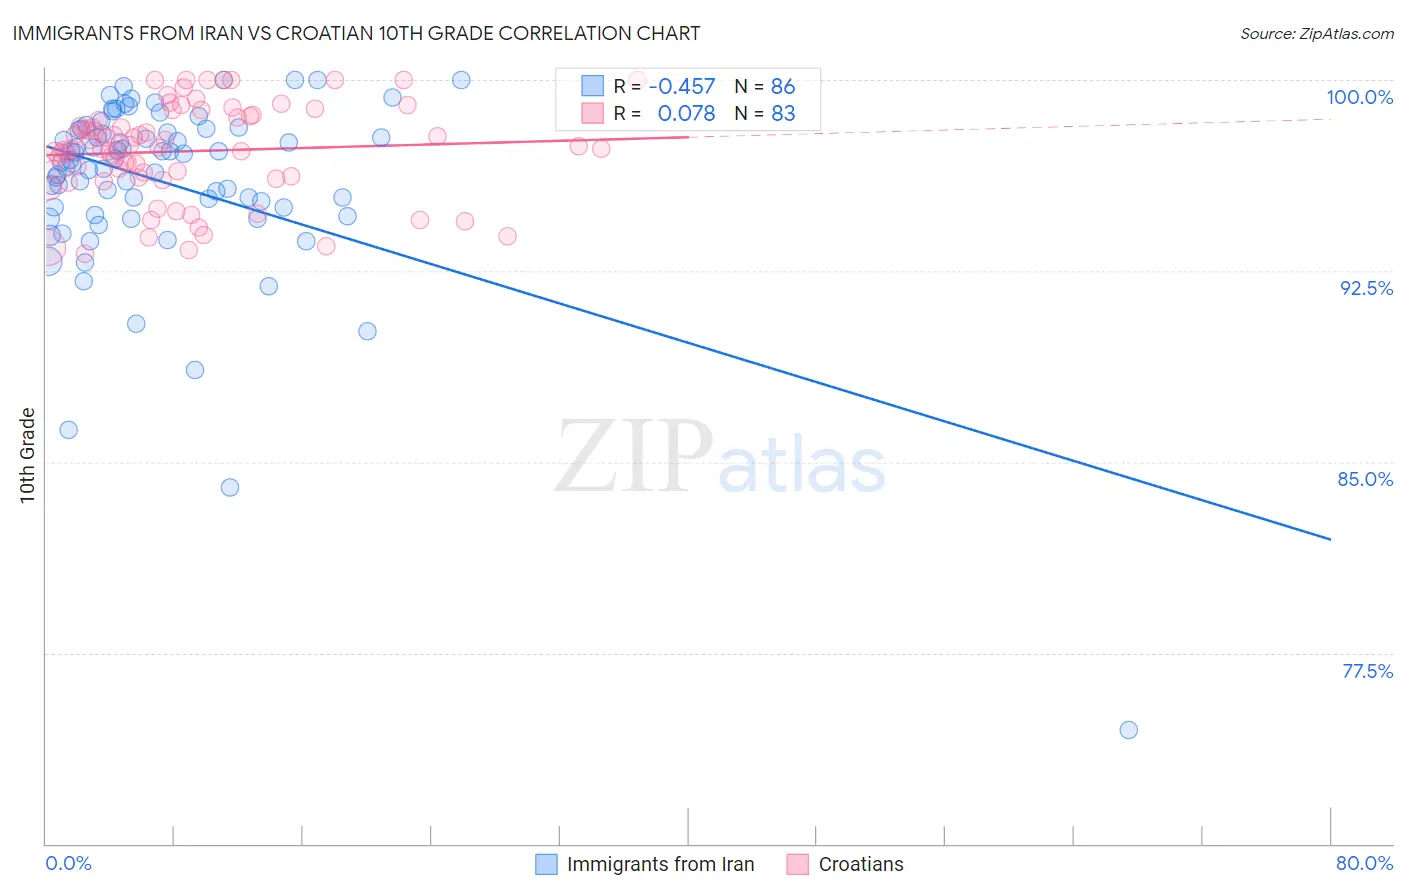
Immigrants from Iran vs Croatian 10th Grade Correlation Chart
The statistical analysis conducted on geographies consisting of 279,867,553 people shows a moderate negative correlation between the proportion of Immigrants from Iran and percentage of population with at least 10th grade education in the United States with a correlation coefficient (R) of -0.457 and weighted average of 94.3%. Similarly, the statistical analysis conducted on geographies consisting of 375,734,264 people shows a slight positive correlation between the proportion of Croatians and percentage of population with at least 10th grade education in the United States with a correlation coefficient (R) of 0.078 and weighted average of 95.7%, a difference of 1.5%.
10th Grade Correlation Summary
| Measurement | Immigrants from Iran | Croatian |
| Minimum | 74.5% | 93.2% |
| Maximum | 100.0% | 100.0% |
| Range | 25.5% | 6.8% |
| Mean | 96.0% | 97.2% |
| Median | 96.8% | 97.3% |
| Interquartile 25% (IQ1) | 95.0% | 96.2% |
| Interquartile 75% (IQ3) | 98.0% | 98.6% |
| Interquartile Range (IQR) | 3.0% | 2.4% |
| Standard Deviation (Sample) | 3.7% | 1.8% |
| Standard Deviation (Population) | 3.7% | 1.8% |
Similar Demographics by 10th Grade
Demographics Similar to Immigrants from Iran by 10th Grade
In terms of 10th grade, the demographic groups most similar to Immigrants from Iran are American (94.3%, a difference of 0.0%), Basque (94.3%, a difference of 0.020%), Israeli (94.3%, a difference of 0.020%), Inupiat (94.4%, a difference of 0.030%), and Cree (94.4%, a difference of 0.030%).
| Demographics | Rating | Rank | 10th Grade |
| Immigrants | Israel | 95.4 /100 | #119 | Exceptional 94.4% |
| Immigrants | Taiwan | 95.3 /100 | #120 | Exceptional 94.4% |
| Immigrants | Belarus | 95.2 /100 | #121 | Exceptional 94.4% |
| Inupiat | 95.1 /100 | #122 | Exceptional 94.4% |
| Cree | 95.1 /100 | #123 | Exceptional 94.4% |
| Basques | 94.9 /100 | #124 | Exceptional 94.3% |
| Americans | 94.4 /100 | #125 | Exceptional 94.3% |
| Immigrants | Iran | 94.4 /100 | #126 | Exceptional 94.3% |
| Israelis | 93.8 /100 | #127 | Exceptional 94.3% |
| Potawatomi | 93.6 /100 | #128 | Exceptional 94.3% |
| Iroquois | 92.8 /100 | #129 | Exceptional 94.3% |
| Immigrants | Greece | 92.7 /100 | #130 | Exceptional 94.3% |
| Immigrants | Eastern Europe | 92.5 /100 | #131 | Exceptional 94.3% |
| Immigrants | Russia | 92.4 /100 | #132 | Exceptional 94.3% |
| Creek | 91.9 /100 | #133 | Exceptional 94.2% |
Demographics Similar to Croatians by 10th Grade
In terms of 10th grade, the demographic groups most similar to Croatians are Finnish (95.8%, a difference of 0.020%), Danish (95.7%, a difference of 0.040%), Lithuanian (95.8%, a difference of 0.080%), Tlingit-Haida (95.7%, a difference of 0.080%), and German (95.8%, a difference of 0.090%).
| Demographics | Rating | Rank | 10th Grade |
| Slovenes | 100.0 /100 | #3 | Exceptional 95.9% |
| Swedes | 100.0 /100 | #4 | Exceptional 95.9% |
| Carpatho Rusyns | 100.0 /100 | #5 | Exceptional 95.9% |
| Poles | 100.0 /100 | #6 | Exceptional 95.8% |
| Germans | 100.0 /100 | #7 | Exceptional 95.8% |
| Lithuanians | 100.0 /100 | #8 | Exceptional 95.8% |
| Finns | 100.0 /100 | #9 | Exceptional 95.8% |
| Croatians | 100.0 /100 | #10 | Exceptional 95.7% |
| Danes | 100.0 /100 | #11 | Exceptional 95.7% |
| Tlingit-Haida | 100.0 /100 | #12 | Exceptional 95.7% |
| English | 100.0 /100 | #13 | Exceptional 95.6% |
| Tsimshian | 100.0 /100 | #14 | Exceptional 95.6% |
| Irish | 100.0 /100 | #15 | Exceptional 95.6% |
| Scottish | 100.0 /100 | #16 | Exceptional 95.6% |
| Latvians | 100.0 /100 | #17 | Exceptional 95.6% |