Immigrants from Hungary vs Korean Nursery School
COMPARE
Immigrants from Hungary
Korean
Nursery School
Nursery School Comparison
Immigrants from Hungary
Koreans
98.1%
NURSERY SCHOOL
89.3/ 100
METRIC RATING
135th/ 347
METRIC RANK
97.7%
NURSERY SCHOOL
1.4/ 100
METRIC RATING
240th/ 347
METRIC RANK
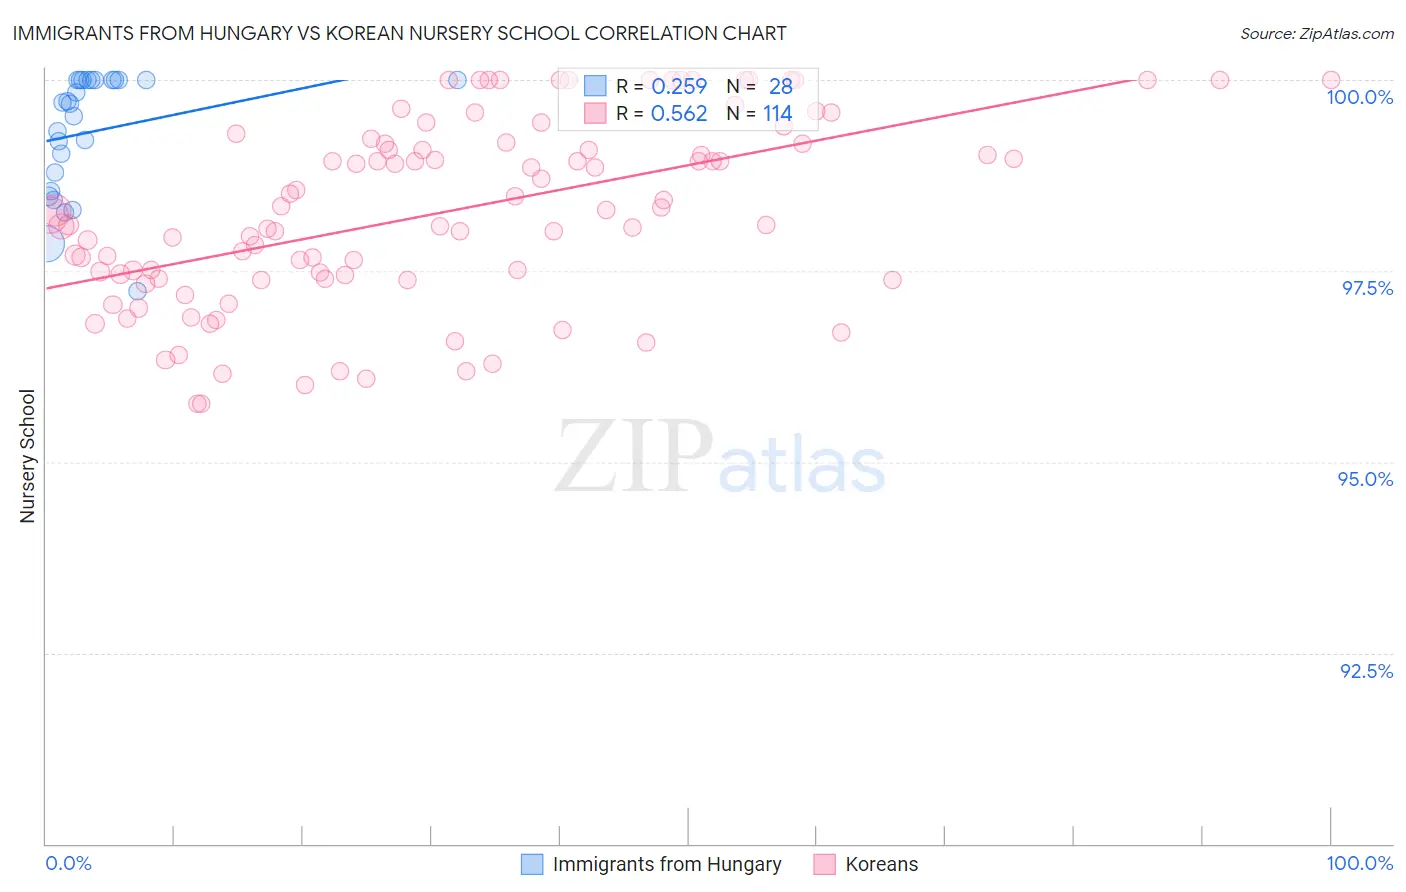
Immigrants from Hungary vs Korean Nursery School Correlation Chart
The statistical analysis conducted on geographies consisting of 195,707,305 people shows a weak positive correlation between the proportion of Immigrants from Hungary and percentage of population with at least nursery school education in the United States with a correlation coefficient (R) of 0.259 and weighted average of 98.1%. Similarly, the statistical analysis conducted on geographies consisting of 510,935,951 people shows a substantial positive correlation between the proportion of Koreans and percentage of population with at least nursery school education in the United States with a correlation coefficient (R) of 0.562 and weighted average of 97.7%, a difference of 0.48%.
Nursery School Correlation Summary
| Measurement | Immigrants from Hungary | Korean |
| Minimum | 97.2% | 95.8% |
| Maximum | 100.0% | 100.0% |
| Range | 2.8% | 4.2% |
| Mean | 99.3% | 98.3% |
| Median | 99.7% | 98.3% |
| Interquartile 25% (IQ1) | 98.7% | 97.4% |
| Interquartile 75% (IQ3) | 100.0% | 99.2% |
| Interquartile Range (IQR) | 1.3% | 1.8% |
| Standard Deviation (Sample) | 0.79% | 1.2% |
| Standard Deviation (Population) | 0.78% | 1.2% |
Similar Demographics by Nursery School
Demographics Similar to Immigrants from Hungary by Nursery School
In terms of nursery school, the demographic groups most similar to Immigrants from Hungary are Immigrants from Bulgaria (98.1%, a difference of 0.0%), Immigrants from Kuwait (98.1%, a difference of 0.0%), Seminole (98.2%, a difference of 0.010%), Immigrants from Europe (98.1%, a difference of 0.010%), and Israeli (98.1%, a difference of 0.010%).
| Demographics | Rating | Rank | Nursery School |
| Immigrants | Serbia | 92.4 /100 | #128 | Exceptional 98.2% |
| Cambodians | 91.4 /100 | #129 | Exceptional 98.2% |
| Immigrants | Croatia | 91.4 /100 | #130 | Exceptional 98.2% |
| Spaniards | 91.1 /100 | #131 | Exceptional 98.2% |
| Seminole | 90.9 /100 | #132 | Exceptional 98.2% |
| Immigrants | Europe | 90.7 /100 | #133 | Exceptional 98.1% |
| Immigrants | Bulgaria | 89.4 /100 | #134 | Excellent 98.1% |
| Immigrants | Hungary | 89.3 /100 | #135 | Excellent 98.1% |
| Immigrants | Kuwait | 88.9 /100 | #136 | Excellent 98.1% |
| Israelis | 88.2 /100 | #137 | Excellent 98.1% |
| Immigrants | Romania | 88.0 /100 | #138 | Excellent 98.1% |
| Blackfeet | 87.5 /100 | #139 | Excellent 98.1% |
| Palestinians | 83.7 /100 | #140 | Excellent 98.1% |
| Immigrants | Turkey | 83.0 /100 | #141 | Excellent 98.1% |
| Burmese | 81.7 /100 | #142 | Excellent 98.1% |
Demographics Similar to Koreans by Nursery School
In terms of nursery school, the demographic groups most similar to Koreans are Nigerian (97.7%, a difference of 0.010%), Immigrants from Eastern Asia (97.7%, a difference of 0.010%), Immigrants from Malaysia (97.7%, a difference of 0.020%), Immigrants from Western Asia (97.7%, a difference of 0.020%), and Immigrants from Indonesia (97.7%, a difference of 0.020%).
| Demographics | Rating | Rank | Nursery School |
| U.S. Virgin Islanders | 2.1 /100 | #233 | Tragic 97.7% |
| Colombians | 2.1 /100 | #234 | Tragic 97.7% |
| Immigrants | Pakistan | 2.1 /100 | #235 | Tragic 97.7% |
| Immigrants | Malaysia | 1.9 /100 | #236 | Tragic 97.7% |
| Immigrants | Western Asia | 1.9 /100 | #237 | Tragic 97.7% |
| Nigerians | 1.7 /100 | #238 | Tragic 97.7% |
| Immigrants | Eastern Asia | 1.6 /100 | #239 | Tragic 97.7% |
| Koreans | 1.4 /100 | #240 | Tragic 97.7% |
| Immigrants | Indonesia | 1.1 /100 | #241 | Tragic 97.7% |
| Liberians | 1.1 /100 | #242 | Tragic 97.7% |
| Asians | 1.1 /100 | #243 | Tragic 97.6% |
| South Americans | 1.0 /100 | #244 | Tragic 97.6% |
| Bolivians | 1.0 /100 | #245 | Tragic 97.6% |
| Peruvians | 1.0 /100 | #246 | Tragic 97.6% |
| Immigrants | Middle Africa | 0.9 /100 | #247 | Tragic 97.6% |