Immigrants from Hungary vs Black/African American Professional Degree
COMPARE
Immigrants from Hungary
Black/African American
Professional Degree
Professional Degree Comparison
Immigrants from Hungary
Blacks/African Americans
5.5%
PROFESSIONAL DEGREE
99.9/ 100
METRIC RATING
69th/ 347
METRIC RANK
3.4%
PROFESSIONAL DEGREE
0.2/ 100
METRIC RATING
300th/ 347
METRIC RANK
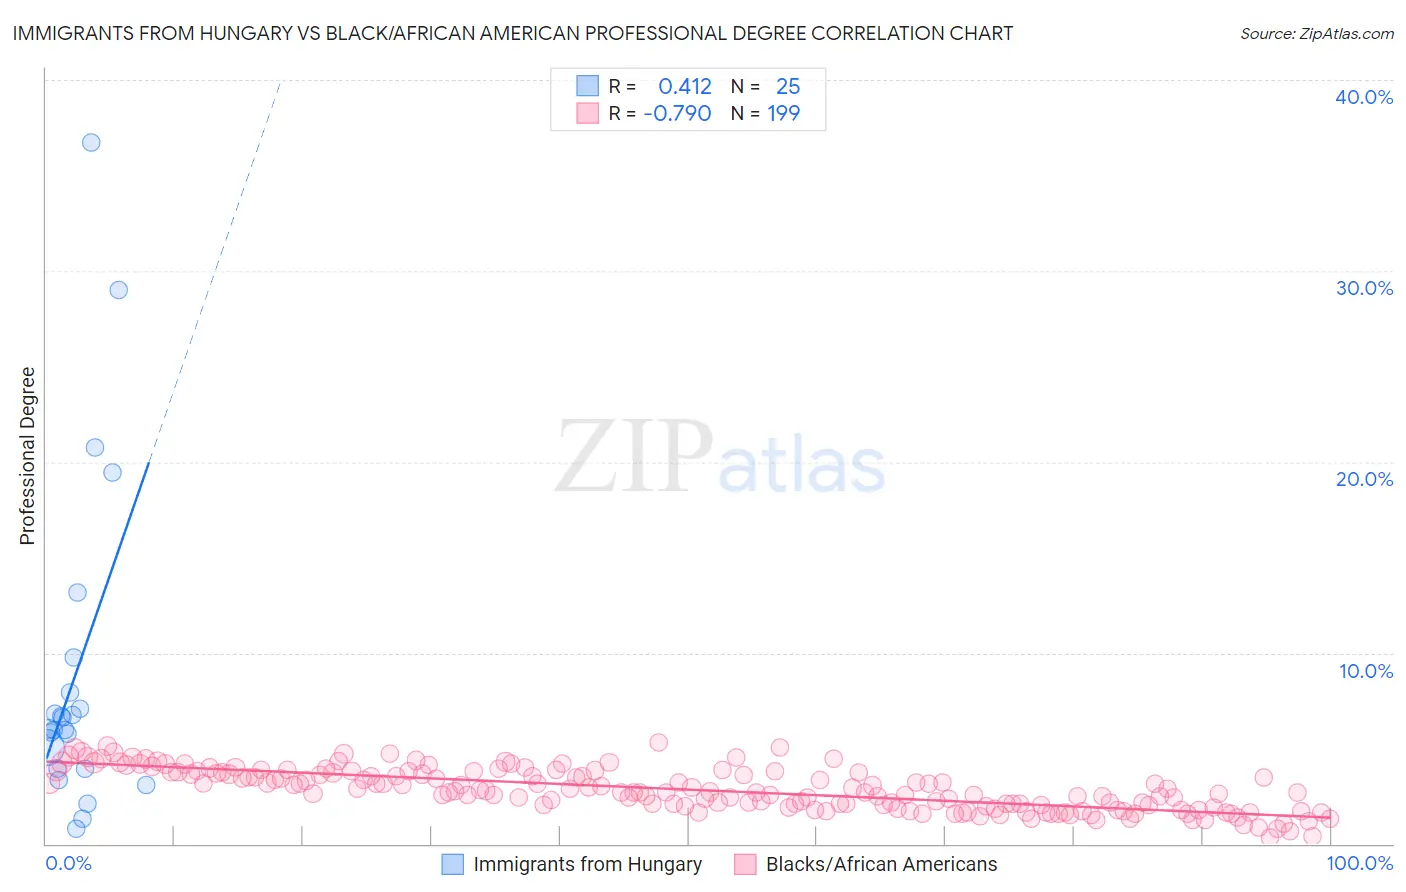
Immigrants from Hungary vs Black/African American Professional Degree Correlation Chart
The statistical analysis conducted on geographies consisting of 195,587,286 people shows a moderate positive correlation between the proportion of Immigrants from Hungary and percentage of population with at least professional degree education in the United States with a correlation coefficient (R) of 0.412 and weighted average of 5.5%. Similarly, the statistical analysis conducted on geographies consisting of 557,362,450 people shows a strong negative correlation between the proportion of Blacks/African Americans and percentage of population with at least professional degree education in the United States with a correlation coefficient (R) of -0.790 and weighted average of 3.4%, a difference of 60.4%.
Professional Degree Correlation Summary
| Measurement | Immigrants from Hungary | Black/African American |
| Minimum | 0.81% | 0.36% |
| Maximum | 36.7% | 5.3% |
| Range | 35.9% | 4.9% |
| Mean | 8.9% | 2.8% |
| Median | 6.0% | 2.7% |
| Interquartile 25% (IQ1) | 3.9% | 2.0% |
| Interquartile 75% (IQ3) | 8.8% | 3.8% |
| Interquartile Range (IQR) | 4.9% | 1.8% |
| Standard Deviation (Sample) | 8.7% | 1.1% |
| Standard Deviation (Population) | 8.5% | 1.1% |
Similar Demographics by Professional Degree
Demographics Similar to Immigrants from Hungary by Professional Degree
In terms of professional degree, the demographic groups most similar to Immigrants from Hungary are Immigrants from Lebanon (5.5%, a difference of 0.080%), Immigrants from Bulgaria (5.5%, a difference of 0.26%), Bhutanese (5.4%, a difference of 0.33%), Immigrants from Kazakhstan (5.5%, a difference of 0.59%), and Immigrants from Bolivia (5.5%, a difference of 0.83%).
| Demographics | Rating | Rank | Professional Degree |
| Immigrants | Belarus | 99.9 /100 | #62 | Exceptional 5.5% |
| Asians | 99.9 /100 | #63 | Exceptional 5.5% |
| Immigrants | Asia | 99.9 /100 | #64 | Exceptional 5.5% |
| Immigrants | Bolivia | 99.9 /100 | #65 | Exceptional 5.5% |
| Immigrants | Kazakhstan | 99.9 /100 | #66 | Exceptional 5.5% |
| Immigrants | Bulgaria | 99.9 /100 | #67 | Exceptional 5.5% |
| Immigrants | Lebanon | 99.9 /100 | #68 | Exceptional 5.5% |
| Immigrants | Hungary | 99.9 /100 | #69 | Exceptional 5.5% |
| Bhutanese | 99.8 /100 | #70 | Exceptional 5.4% |
| Immigrants | Western Asia | 99.8 /100 | #71 | Exceptional 5.4% |
| Lithuanians | 99.8 /100 | #72 | Exceptional 5.4% |
| Immigrants | Romania | 99.8 /100 | #73 | Exceptional 5.4% |
| Ethiopians | 99.7 /100 | #74 | Exceptional 5.4% |
| Immigrants | Indonesia | 99.7 /100 | #75 | Exceptional 5.3% |
| Immigrants | Canada | 99.7 /100 | #76 | Exceptional 5.3% |
Demographics Similar to Blacks/African Americans by Professional Degree
In terms of professional degree, the demographic groups most similar to Blacks/African Americans are Immigrants from Yemen (3.4%, a difference of 0.13%), Immigrants from Dominican Republic (3.4%, a difference of 0.14%), Malaysian (3.4%, a difference of 0.25%), Ottawa (3.4%, a difference of 0.80%), and Immigrants from Liberia (3.4%, a difference of 0.85%).
| Demographics | Rating | Rank | Professional Degree |
| Immigrants | Honduras | 0.3 /100 | #293 | Tragic 3.5% |
| Paiute | 0.3 /100 | #294 | Tragic 3.4% |
| Immigrants | Guatemala | 0.2 /100 | #295 | Tragic 3.4% |
| Hawaiians | 0.2 /100 | #296 | Tragic 3.4% |
| Immigrants | Liberia | 0.2 /100 | #297 | Tragic 3.4% |
| Ottawa | 0.2 /100 | #298 | Tragic 3.4% |
| Immigrants | Yemen | 0.2 /100 | #299 | Tragic 3.4% |
| Blacks/African Americans | 0.2 /100 | #300 | Tragic 3.4% |
| Immigrants | Dominican Republic | 0.2 /100 | #301 | Tragic 3.4% |
| Malaysians | 0.2 /100 | #302 | Tragic 3.4% |
| Immigrants | Haiti | 0.2 /100 | #303 | Tragic 3.4% |
| Cajuns | 0.2 /100 | #304 | Tragic 3.4% |
| Chickasaw | 0.1 /100 | #305 | Tragic 3.4% |
| Cape Verdeans | 0.1 /100 | #306 | Tragic 3.4% |
| Samoans | 0.1 /100 | #307 | Tragic 3.3% |