Immigrants from Hong Kong vs Immigrants from Nepal 4th Grade
COMPARE
Immigrants from Hong Kong
Immigrants from Nepal
4th Grade
4th Grade Comparison
Immigrants from Hong Kong
Immigrants from Nepal
96.9%
4TH GRADE
0.1/ 100
METRIC RATING
281st/ 347
METRIC RANK
97.3%
4TH GRADE
7.7/ 100
METRIC RATING
214th/ 347
METRIC RANK
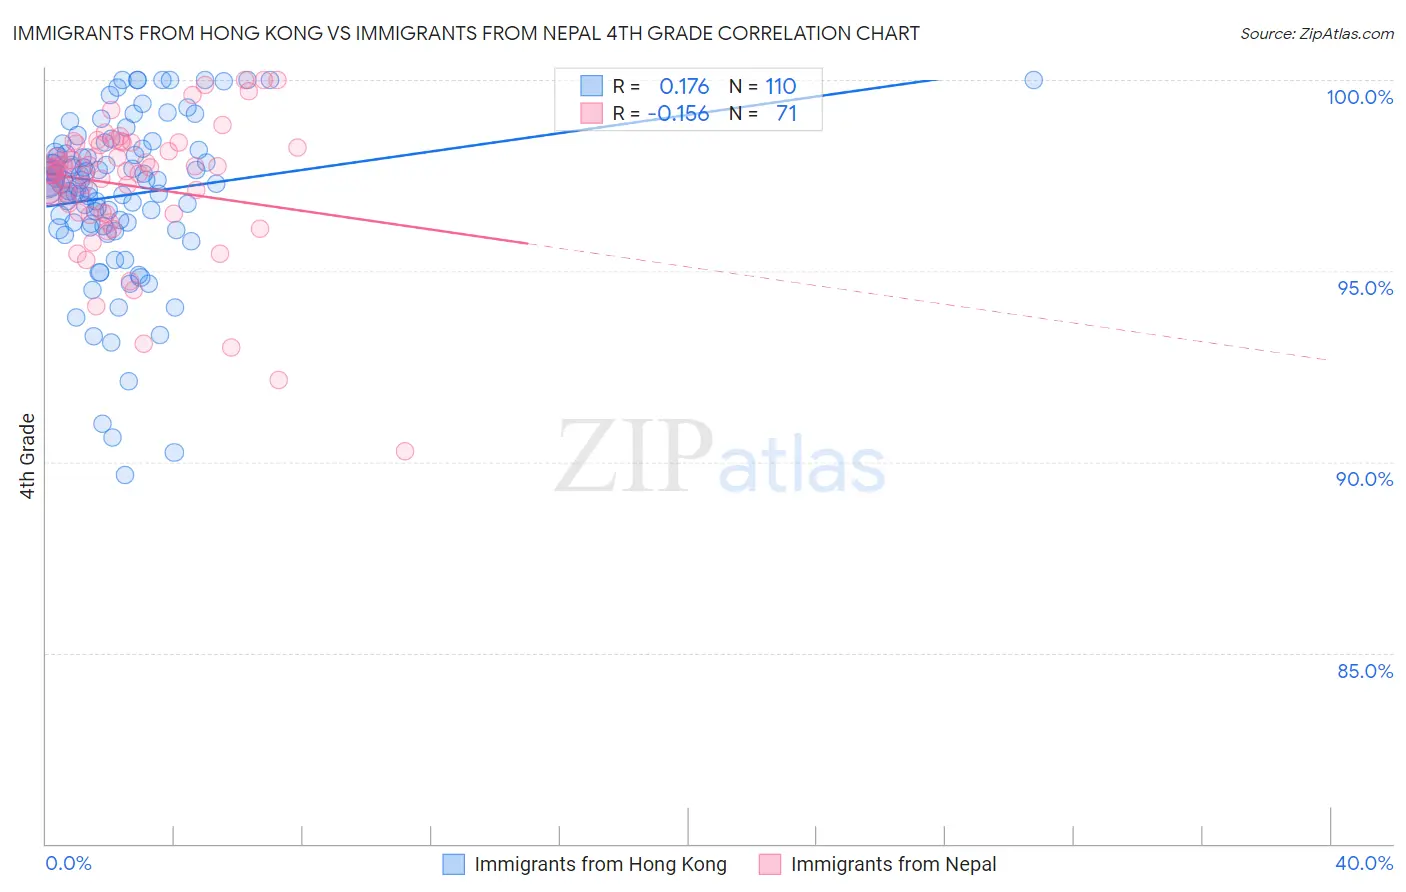
Immigrants from Hong Kong vs Immigrants from Nepal 4th Grade Correlation Chart
The statistical analysis conducted on geographies consisting of 253,948,669 people shows a poor positive correlation between the proportion of Immigrants from Hong Kong and percentage of population with at least 4th grade education in the United States with a correlation coefficient (R) of 0.176 and weighted average of 96.9%. Similarly, the statistical analysis conducted on geographies consisting of 186,739,570 people shows a poor negative correlation between the proportion of Immigrants from Nepal and percentage of population with at least 4th grade education in the United States with a correlation coefficient (R) of -0.156 and weighted average of 97.3%, a difference of 0.45%.
4th Grade Correlation Summary
| Measurement | Immigrants from Hong Kong | Immigrants from Nepal |
| Minimum | 89.7% | 90.3% |
| Maximum | 100.0% | 100.0% |
| Range | 10.3% | 9.7% |
| Mean | 97.0% | 97.2% |
| Median | 97.3% | 97.6% |
| Interquartile 25% (IQ1) | 96.2% | 96.5% |
| Interquartile 75% (IQ3) | 98.1% | 98.3% |
| Interquartile Range (IQR) | 1.9% | 1.8% |
| Standard Deviation (Sample) | 2.1% | 1.8% |
| Standard Deviation (Population) | 2.1% | 1.8% |
Similar Demographics by 4th Grade
Demographics Similar to Immigrants from Hong Kong by 4th Grade
In terms of 4th grade, the demographic groups most similar to Immigrants from Hong Kong are Immigrants from Trinidad and Tobago (96.8%, a difference of 0.0%), Immigrants from Philippines (96.8%, a difference of 0.0%), Barbadian (96.9%, a difference of 0.010%), Afghan (96.9%, a difference of 0.020%), and Immigrants from St. Vincent and the Grenadines (96.8%, a difference of 0.020%).
| Demographics | Rating | Rank | 4th Grade |
| Trinidadians and Tobagonians | 0.1 /100 | #274 | Tragic 96.9% |
| Immigrants | Ghana | 0.1 /100 | #275 | Tragic 96.9% |
| Yaqui | 0.1 /100 | #276 | Tragic 96.9% |
| Immigrants | Western Africa | 0.1 /100 | #277 | Tragic 96.9% |
| Immigrants | Bolivia | 0.1 /100 | #278 | Tragic 96.9% |
| Afghans | 0.1 /100 | #279 | Tragic 96.9% |
| Barbadians | 0.1 /100 | #280 | Tragic 96.9% |
| Immigrants | Hong Kong | 0.1 /100 | #281 | Tragic 96.9% |
| Immigrants | Trinidad and Tobago | 0.1 /100 | #282 | Tragic 96.8% |
| Immigrants | Philippines | 0.1 /100 | #283 | Tragic 96.8% |
| Immigrants | St. Vincent and the Grenadines | 0.1 /100 | #284 | Tragic 96.8% |
| Immigrants | Barbados | 0.0 /100 | #285 | Tragic 96.8% |
| Immigrants | Thailand | 0.0 /100 | #286 | Tragic 96.8% |
| Houma | 0.0 /100 | #287 | Tragic 96.8% |
| Immigrants | Afghanistan | 0.0 /100 | #288 | Tragic 96.8% |
Demographics Similar to Immigrants from Nepal by 4th Grade
In terms of 4th grade, the demographic groups most similar to Immigrants from Nepal are Tohono O'odham (97.3%, a difference of 0.010%), Costa Rican (97.3%, a difference of 0.010%), Immigrants from Morocco (97.3%, a difference of 0.010%), Samoan (97.3%, a difference of 0.010%), and Laotian (97.3%, a difference of 0.020%).
| Demographics | Rating | Rank | 4th Grade |
| Moroccans | 11.3 /100 | #207 | Poor 97.3% |
| Immigrants | Bahamas | 10.8 /100 | #208 | Poor 97.3% |
| Laotians | 9.3 /100 | #209 | Tragic 97.3% |
| Immigrants | Oceania | 9.1 /100 | #210 | Tragic 97.3% |
| Sudanese | 9.0 /100 | #211 | Tragic 97.3% |
| Tohono O'odham | 8.4 /100 | #212 | Tragic 97.3% |
| Costa Ricans | 8.3 /100 | #213 | Tragic 97.3% |
| Immigrants | Nepal | 7.7 /100 | #214 | Tragic 97.3% |
| Immigrants | Morocco | 7.1 /100 | #215 | Tragic 97.3% |
| Samoans | 6.8 /100 | #216 | Tragic 97.3% |
| Sierra Leoneans | 6.5 /100 | #217 | Tragic 97.3% |
| Iraqis | 6.3 /100 | #218 | Tragic 97.3% |
| Tongans | 5.8 /100 | #219 | Tragic 97.3% |
| South American Indians | 5.5 /100 | #220 | Tragic 97.3% |
| Immigrants | Panama | 5.4 /100 | #221 | Tragic 97.3% |