Immigrants from Hong Kong vs Black/African American Master's Degree
COMPARE
Immigrants from Hong Kong
Black/African American
Master's Degree
Master's Degree Comparison
Immigrants from Hong Kong
Blacks/African Americans
20.5%
MASTER'S DEGREE
100.0/ 100
METRIC RATING
19th/ 347
METRIC RANK
12.1%
MASTER'S DEGREE
0.3/ 100
METRIC RATING
276th/ 347
METRIC RANK
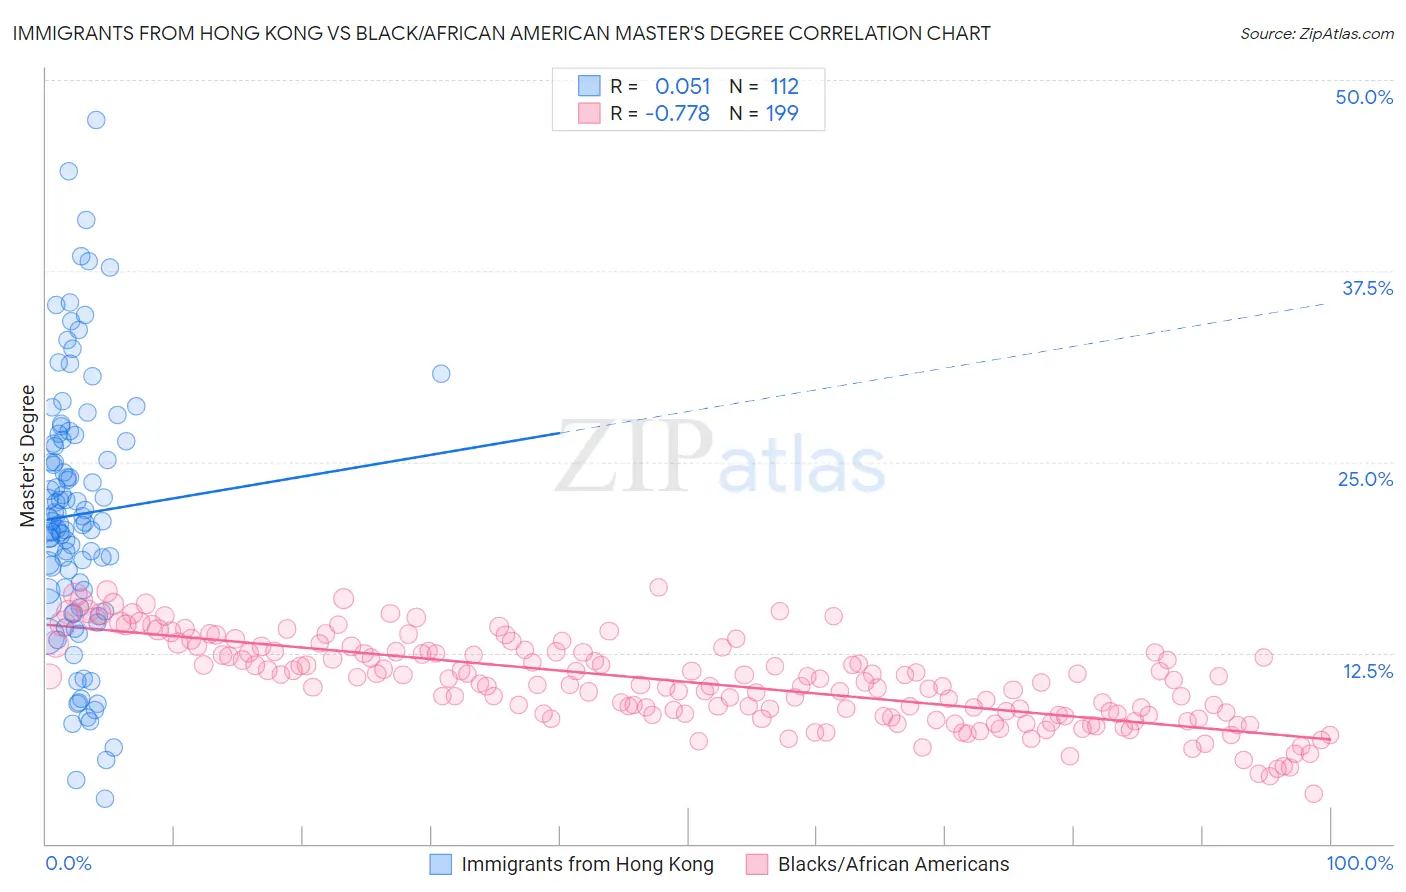
Immigrants from Hong Kong vs Black/African American Master's Degree Correlation Chart
The statistical analysis conducted on geographies consisting of 253,947,811 people shows a slight positive correlation between the proportion of Immigrants from Hong Kong and percentage of population with at least master's degree education in the United States with a correlation coefficient (R) of 0.051 and weighted average of 20.5%. Similarly, the statistical analysis conducted on geographies consisting of 563,961,779 people shows a strong negative correlation between the proportion of Blacks/African Americans and percentage of population with at least master's degree education in the United States with a correlation coefficient (R) of -0.778 and weighted average of 12.1%, a difference of 69.5%.
Master's Degree Correlation Summary
| Measurement | Immigrants from Hong Kong | Black/African American |
| Minimum | 2.9% | 3.3% |
| Maximum | 47.4% | 16.8% |
| Range | 44.5% | 13.5% |
| Mean | 21.6% | 10.6% |
| Median | 21.1% | 10.6% |
| Interquartile 25% (IQ1) | 16.1% | 8.4% |
| Interquartile 75% (IQ3) | 26.4% | 12.6% |
| Interquartile Range (IQR) | 10.3% | 4.1% |
| Standard Deviation (Sample) | 8.5% | 2.8% |
| Standard Deviation (Population) | 8.5% | 2.8% |
Similar Demographics by Master's Degree
Demographics Similar to Immigrants from Hong Kong by Master's Degree
In terms of master's degree, the demographic groups most similar to Immigrants from Hong Kong are Indian (Asian) (20.5%, a difference of 0.020%), Immigrants from Ireland (20.4%, a difference of 0.13%), Soviet Union (20.5%, a difference of 0.35%), Israeli (20.3%, a difference of 0.55%), and Immigrants from France (20.3%, a difference of 0.83%).
| Demographics | Rating | Rank | Master's Degree |
| Eastern Europeans | 100.0 /100 | #12 | Exceptional 21.1% |
| Immigrants | Australia | 100.0 /100 | #13 | Exceptional 20.9% |
| Immigrants | Switzerland | 100.0 /100 | #14 | Exceptional 20.9% |
| Immigrants | Eastern Asia | 100.0 /100 | #15 | Exceptional 20.8% |
| Immigrants | Belgium | 100.0 /100 | #16 | Exceptional 20.8% |
| Immigrants | South Central Asia | 100.0 /100 | #17 | Exceptional 20.7% |
| Soviet Union | 100.0 /100 | #18 | Exceptional 20.5% |
| Immigrants | Hong Kong | 100.0 /100 | #19 | Exceptional 20.5% |
| Indians (Asian) | 100.0 /100 | #20 | Exceptional 20.5% |
| Immigrants | Ireland | 100.0 /100 | #21 | Exceptional 20.4% |
| Israelis | 100.0 /100 | #22 | Exceptional 20.3% |
| Immigrants | France | 100.0 /100 | #23 | Exceptional 20.3% |
| Immigrants | Sweden | 100.0 /100 | #24 | Exceptional 20.3% |
| Immigrants | Japan | 100.0 /100 | #25 | Exceptional 20.0% |
| Cambodians | 100.0 /100 | #26 | Exceptional 20.0% |
Demographics Similar to Blacks/African Americans by Master's Degree
In terms of master's degree, the demographic groups most similar to Blacks/African Americans are Immigrants from Caribbean (12.1%, a difference of 0.010%), Potawatomi (12.1%, a difference of 0.010%), Cuban (12.1%, a difference of 0.050%), Cape Verdean (12.1%, a difference of 0.070%), and Immigrants from Belize (12.1%, a difference of 0.090%).
| Demographics | Rating | Rank | Master's Degree |
| Central Americans | 0.3 /100 | #269 | Tragic 12.2% |
| Salvadorans | 0.3 /100 | #270 | Tragic 12.2% |
| Haitians | 0.3 /100 | #271 | Tragic 12.1% |
| Comanche | 0.3 /100 | #272 | Tragic 12.1% |
| Blackfeet | 0.3 /100 | #273 | Tragic 12.1% |
| Cape Verdeans | 0.3 /100 | #274 | Tragic 12.1% |
| Cubans | 0.3 /100 | #275 | Tragic 12.1% |
| Blacks/African Americans | 0.3 /100 | #276 | Tragic 12.1% |
| Immigrants | Caribbean | 0.3 /100 | #277 | Tragic 12.1% |
| Potawatomi | 0.3 /100 | #278 | Tragic 12.1% |
| Immigrants | Belize | 0.2 /100 | #279 | Tragic 12.1% |
| Immigrants | Dominican Republic | 0.2 /100 | #280 | Tragic 12.1% |
| Malaysians | 0.2 /100 | #281 | Tragic 12.0% |
| Immigrants | El Salvador | 0.2 /100 | #282 | Tragic 12.0% |
| Hondurans | 0.2 /100 | #283 | Tragic 11.9% |