Immigrants from Haiti vs Ottawa Master's Degree
COMPARE
Immigrants from Haiti
Ottawa
Master's Degree
Master's Degree Comparison
Immigrants from Haiti
Ottawa
11.8%
MASTER'S DEGREE
0.1/ 100
METRIC RATING
287th/ 347
METRIC RANK
11.9%
MASTER'S DEGREE
0.2/ 100
METRIC RATING
284th/ 347
METRIC RANK
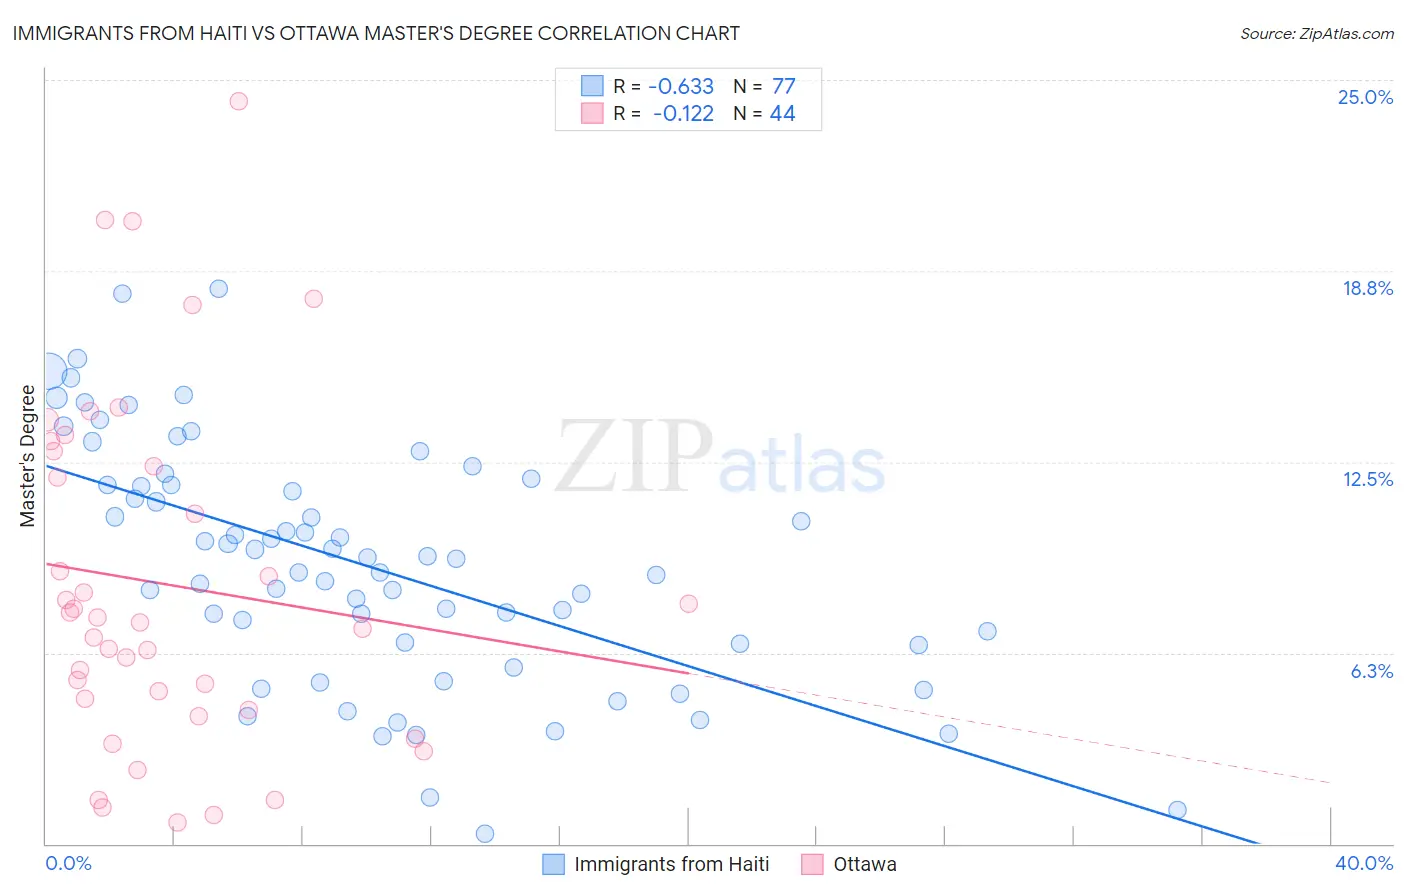
Immigrants from Haiti vs Ottawa Master's Degree Correlation Chart
The statistical analysis conducted on geographies consisting of 225,216,458 people shows a significant negative correlation between the proportion of Immigrants from Haiti and percentage of population with at least master's degree education in the United States with a correlation coefficient (R) of -0.633 and weighted average of 11.8%. Similarly, the statistical analysis conducted on geographies consisting of 49,953,326 people shows a poor negative correlation between the proportion of Ottawa and percentage of population with at least master's degree education in the United States with a correlation coefficient (R) of -0.122 and weighted average of 11.9%, a difference of 0.74%.
Master's Degree Correlation Summary
| Measurement | Immigrants from Haiti | Ottawa |
| Minimum | 0.34% | 0.69% |
| Maximum | 18.2% | 24.3% |
| Range | 17.8% | 23.6% |
| Mean | 9.1% | 8.5% |
| Median | 9.3% | 7.3% |
| Interquartile 25% (IQ1) | 6.5% | 4.6% |
| Interquartile 75% (IQ3) | 11.7% | 12.6% |
| Interquartile Range (IQR) | 5.2% | 8.0% |
| Standard Deviation (Sample) | 3.9% | 5.7% |
| Standard Deviation (Population) | 3.9% | 5.6% |
Demographics Similar to Immigrants from Haiti and Ottawa by Master's Degree
In terms of master's degree, the demographic groups most similar to Immigrants from Haiti are Immigrants from Honduras (11.8%, a difference of 0.17%), Aleut (11.8%, a difference of 0.20%), Guatemalan (11.7%, a difference of 0.25%), Ute (11.7%, a difference of 0.49%), and Immigrants from Nicaragua (11.8%, a difference of 0.55%). Similarly, the demographic groups most similar to Ottawa are Immigrants from Nicaragua (11.8%, a difference of 0.18%), Aleut (11.8%, a difference of 0.54%), Honduran (11.9%, a difference of 0.72%), Immigrants from Honduras (11.8%, a difference of 0.90%), and Guatemalan (11.7%, a difference of 0.98%).
| Demographics | Rating | Rank | Master's Degree |
| Cubans | 0.3 /100 | #275 | Tragic 12.1% |
| Blacks/African Americans | 0.3 /100 | #276 | Tragic 12.1% |
| Immigrants | Caribbean | 0.3 /100 | #277 | Tragic 12.1% |
| Potawatomi | 0.3 /100 | #278 | Tragic 12.1% |
| Immigrants | Belize | 0.2 /100 | #279 | Tragic 12.1% |
| Immigrants | Dominican Republic | 0.2 /100 | #280 | Tragic 12.1% |
| Malaysians | 0.2 /100 | #281 | Tragic 12.0% |
| Immigrants | El Salvador | 0.2 /100 | #282 | Tragic 12.0% |
| Hondurans | 0.2 /100 | #283 | Tragic 11.9% |
| Ottawa | 0.2 /100 | #284 | Tragic 11.9% |
| Immigrants | Nicaragua | 0.2 /100 | #285 | Tragic 11.8% |
| Aleuts | 0.1 /100 | #286 | Tragic 11.8% |
| Immigrants | Haiti | 0.1 /100 | #287 | Tragic 11.8% |
| Immigrants | Honduras | 0.1 /100 | #288 | Tragic 11.8% |
| Guatemalans | 0.1 /100 | #289 | Tragic 11.7% |
| Ute | 0.1 /100 | #290 | Tragic 11.7% |
| Colville | 0.1 /100 | #291 | Tragic 11.6% |
| Immigrants | Guatemala | 0.1 /100 | #292 | Tragic 11.6% |
| Alaska Natives | 0.1 /100 | #293 | Tragic 11.6% |
| Hawaiians | 0.1 /100 | #294 | Tragic 11.6% |
| Marshallese | 0.1 /100 | #295 | Tragic 11.6% |