Immigrants from Haiti vs Immigrants from Thailand Nursery School
COMPARE
Immigrants from Haiti
Immigrants from Thailand
Nursery School
Nursery School Comparison
Immigrants from Haiti
Immigrants from Thailand
97.0%
NURSERY SCHOOL
0.0/ 100
METRIC RATING
308th/ 347
METRIC RANK
97.3%
NURSERY SCHOOL
0.0/ 100
METRIC RATING
288th/ 347
METRIC RANK
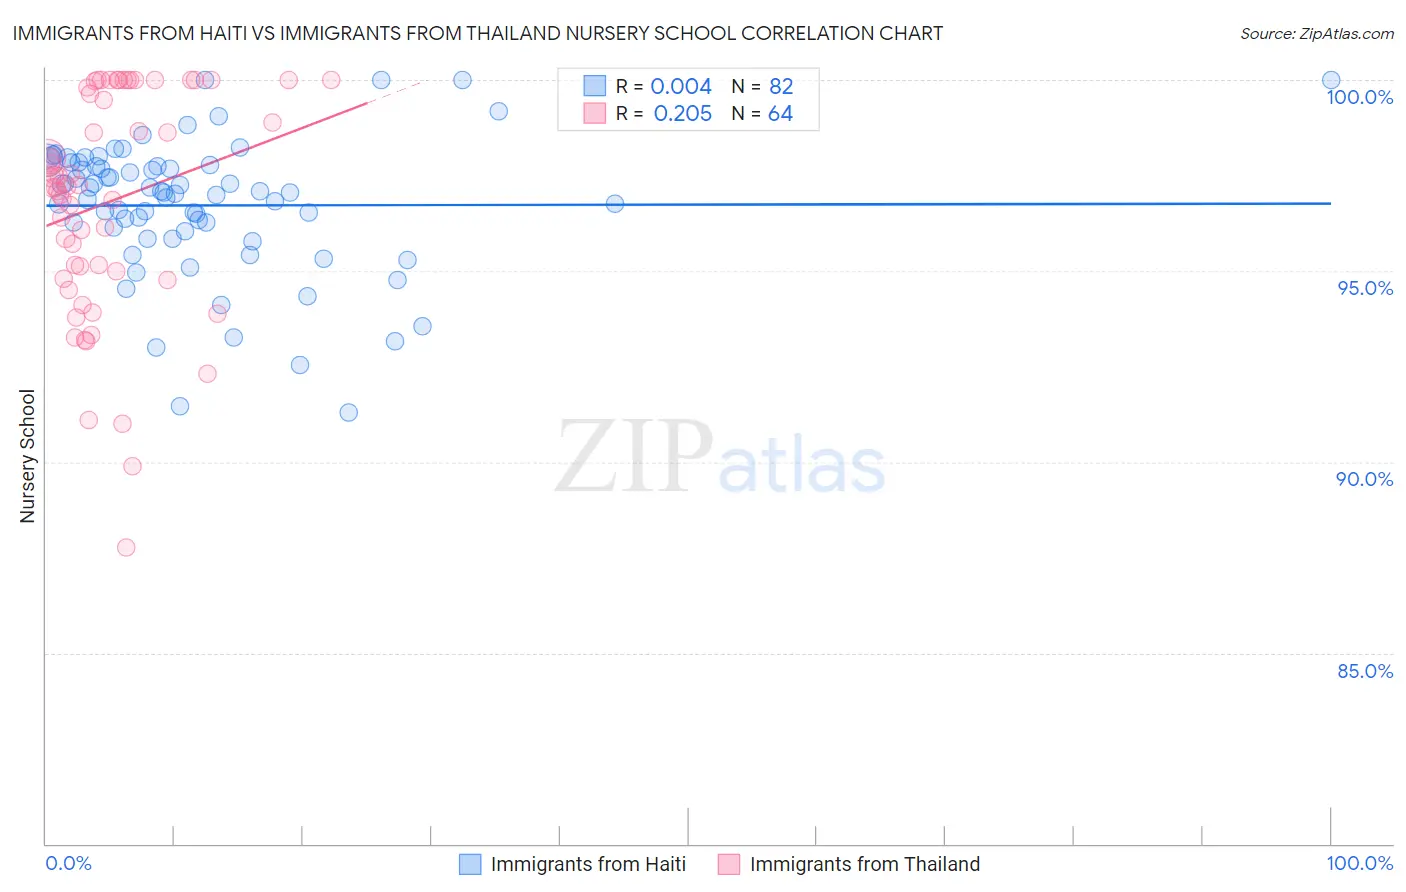
Immigrants from Haiti vs Immigrants from Thailand Nursery School Correlation Chart
The statistical analysis conducted on geographies consisting of 225,286,614 people shows no correlation between the proportion of Immigrants from Haiti and percentage of population with at least nursery school education in the United States with a correlation coefficient (R) of 0.004 and weighted average of 97.0%. Similarly, the statistical analysis conducted on geographies consisting of 317,003,357 people shows a weak positive correlation between the proportion of Immigrants from Thailand and percentage of population with at least nursery school education in the United States with a correlation coefficient (R) of 0.205 and weighted average of 97.3%, a difference of 0.34%.
Nursery School Correlation Summary
| Measurement | Immigrants from Haiti | Immigrants from Thailand |
| Minimum | 91.3% | 87.7% |
| Maximum | 100.0% | 100.0% |
| Range | 8.7% | 12.3% |
| Mean | 96.7% | 96.8% |
| Median | 97.1% | 97.2% |
| Interquartile 25% (IQ1) | 96.0% | 94.9% |
| Interquartile 75% (IQ3) | 97.8% | 99.9% |
| Interquartile Range (IQR) | 1.7% | 5.0% |
| Standard Deviation (Sample) | 1.8% | 2.9% |
| Standard Deviation (Population) | 1.8% | 2.9% |
Demographics Similar to Immigrants from Haiti and Immigrants from Thailand by Nursery School
In terms of nursery school, the demographic groups most similar to Immigrants from Haiti are Hispanic or Latino (97.0%, a difference of 0.0%), Belizean (97.0%, a difference of 0.010%), Ecuadorian (97.1%, a difference of 0.070%), Somali (97.1%, a difference of 0.070%), and Nicaraguan (97.1%, a difference of 0.080%). Similarly, the demographic groups most similar to Immigrants from Thailand are Immigrants from St. Vincent and the Grenadines (97.3%, a difference of 0.010%), Immigrants from Afghanistan (97.3%, a difference of 0.010%), British West Indian (97.3%, a difference of 0.050%), Houma (97.3%, a difference of 0.060%), and Malaysian (97.3%, a difference of 0.070%).
| Demographics | Rating | Rank | Nursery School |
| Immigrants | Thailand | 0.0 /100 | #288 | Tragic 97.3% |
| Immigrants | St. Vincent and the Grenadines | 0.0 /100 | #289 | Tragic 97.3% |
| Immigrants | Afghanistan | 0.0 /100 | #290 | Tragic 97.3% |
| British West Indians | 0.0 /100 | #291 | Tragic 97.3% |
| Houma | 0.0 /100 | #292 | Tragic 97.3% |
| Malaysians | 0.0 /100 | #293 | Tragic 97.3% |
| Immigrants | Grenada | 0.0 /100 | #294 | Tragic 97.3% |
| Immigrants | Immigrants | 0.0 /100 | #295 | Tragic 97.2% |
| Immigrants | Eritrea | 0.0 /100 | #296 | Tragic 97.2% |
| Immigrants | Cuba | 0.0 /100 | #297 | Tragic 97.2% |
| Central American Indians | 0.0 /100 | #298 | Tragic 97.2% |
| Immigrants | Dominica | 0.0 /100 | #299 | Tragic 97.2% |
| Haitians | 0.0 /100 | #300 | Tragic 97.2% |
| Immigrants | South Eastern Asia | 0.0 /100 | #301 | Tragic 97.1% |
| Immigrants | Caribbean | 0.0 /100 | #302 | Tragic 97.1% |
| Nicaraguans | 0.0 /100 | #303 | Tragic 97.1% |
| Ecuadorians | 0.0 /100 | #304 | Tragic 97.1% |
| Somalis | 0.0 /100 | #305 | Tragic 97.1% |
| Belizeans | 0.0 /100 | #306 | Tragic 97.0% |
| Hispanics or Latinos | 0.0 /100 | #307 | Tragic 97.0% |
| Immigrants | Haiti | 0.0 /100 | #308 | Tragic 97.0% |