Immigrants from Haiti vs Bulgarian 6th Grade
COMPARE
Immigrants from Haiti
Bulgarian
6th Grade
6th Grade Comparison
Immigrants from Haiti
Bulgarians
95.6%
6TH GRADE
0.0/ 100
METRIC RATING
306th/ 347
METRIC RANK
97.8%
6TH GRADE
99.9/ 100
METRIC RATING
45th/ 347
METRIC RANK
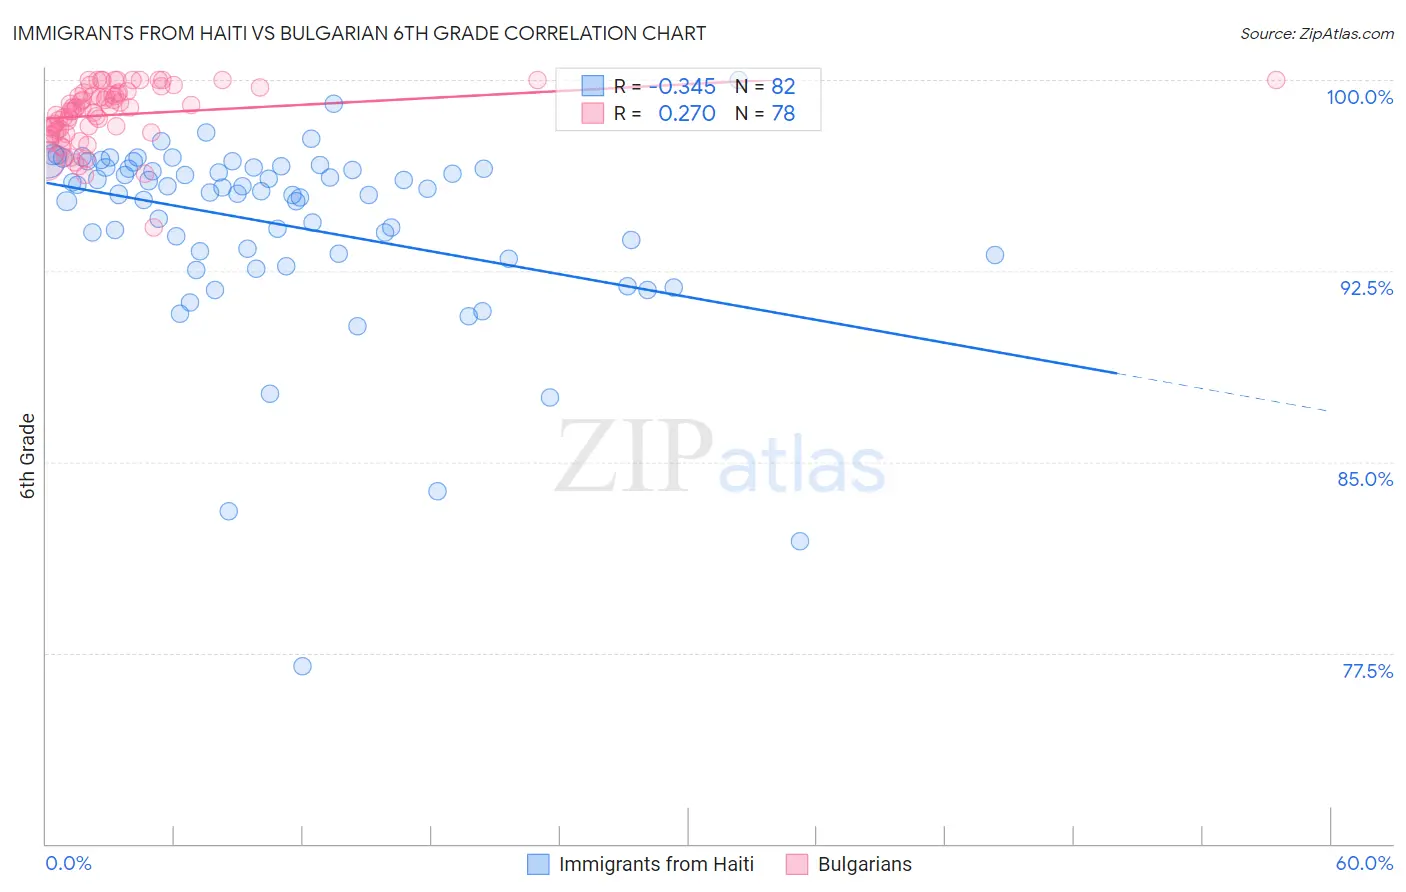
Immigrants from Haiti vs Bulgarian 6th Grade Correlation Chart
The statistical analysis conducted on geographies consisting of 225,287,083 people shows a mild negative correlation between the proportion of Immigrants from Haiti and percentage of population with at least 6th grade education in the United States with a correlation coefficient (R) of -0.345 and weighted average of 95.6%. Similarly, the statistical analysis conducted on geographies consisting of 205,633,223 people shows a weak positive correlation between the proportion of Bulgarians and percentage of population with at least 6th grade education in the United States with a correlation coefficient (R) of 0.270 and weighted average of 97.8%, a difference of 2.3%.
6th Grade Correlation Summary
| Measurement | Immigrants from Haiti | Bulgarian |
| Minimum | 76.9% | 94.2% |
| Maximum | 100.0% | 100.0% |
| Range | 23.1% | 5.8% |
| Mean | 94.3% | 98.6% |
| Median | 95.6% | 98.9% |
| Interquartile 25% (IQ1) | 93.2% | 98.0% |
| Interquartile 75% (IQ3) | 96.6% | 99.5% |
| Interquartile Range (IQR) | 3.4% | 1.6% |
| Standard Deviation (Sample) | 3.8% | 1.1% |
| Standard Deviation (Population) | 3.8% | 1.1% |
Similar Demographics by 6th Grade
Demographics Similar to Immigrants from Haiti by 6th Grade
In terms of 6th grade, the demographic groups most similar to Immigrants from Haiti are Guyanese (95.6%, a difference of 0.020%), Immigrants from Caribbean (95.6%, a difference of 0.030%), Immigrants from Cuba (95.6%, a difference of 0.040%), Indonesian (95.6%, a difference of 0.060%), and Bangladeshi (95.7%, a difference of 0.070%).
| Demographics | Rating | Rank | 6th Grade |
| Immigrants | Laos | 0.0 /100 | #299 | Tragic 95.7% |
| Immigrants | Dominica | 0.0 /100 | #300 | Tragic 95.7% |
| Immigrants | Immigrants | 0.0 /100 | #301 | Tragic 95.7% |
| Immigrants | Burma/Myanmar | 0.0 /100 | #302 | Tragic 95.7% |
| Bangladeshis | 0.0 /100 | #303 | Tragic 95.7% |
| Indonesians | 0.0 /100 | #304 | Tragic 95.6% |
| Immigrants | Cuba | 0.0 /100 | #305 | Tragic 95.6% |
| Immigrants | Haiti | 0.0 /100 | #306 | Tragic 95.6% |
| Guyanese | 0.0 /100 | #307 | Tragic 95.6% |
| Immigrants | Caribbean | 0.0 /100 | #308 | Tragic 95.6% |
| Puerto Ricans | 0.0 /100 | #309 | Tragic 95.5% |
| Ecuadorians | 0.0 /100 | #310 | Tragic 95.5% |
| Immigrants | Portugal | 0.0 /100 | #311 | Tragic 95.5% |
| Immigrants | Guyana | 0.0 /100 | #312 | Tragic 95.5% |
| Nicaraguans | 0.0 /100 | #313 | Tragic 95.4% |
Demographics Similar to Bulgarians by 6th Grade
In terms of 6th grade, the demographic groups most similar to Bulgarians are Arapaho (97.8%, a difference of 0.010%), Czechoslovakian (97.8%, a difference of 0.020%), Native Hawaiian (97.8%, a difference of 0.020%), Celtic (97.8%, a difference of 0.020%), and Estonian (97.8%, a difference of 0.020%).
| Demographics | Rating | Rank | 6th Grade |
| Belgians | 100.0 /100 | #38 | Exceptional 97.9% |
| Luxembourgers | 99.9 /100 | #39 | Exceptional 97.9% |
| Latvians | 99.9 /100 | #40 | Exceptional 97.9% |
| Eastern Europeans | 99.9 /100 | #41 | Exceptional 97.9% |
| Hungarians | 99.9 /100 | #42 | Exceptional 97.8% |
| Northern Europeans | 99.9 /100 | #43 | Exceptional 97.8% |
| Czechoslovakians | 99.9 /100 | #44 | Exceptional 97.8% |
| Bulgarians | 99.9 /100 | #45 | Exceptional 97.8% |
| Arapaho | 99.9 /100 | #46 | Exceptional 97.8% |
| Native Hawaiians | 99.9 /100 | #47 | Exceptional 97.8% |
| Celtics | 99.9 /100 | #48 | Exceptional 97.8% |
| Estonians | 99.8 /100 | #49 | Exceptional 97.8% |
| Immigrants | Scotland | 99.8 /100 | #50 | Exceptional 97.8% |
| Maltese | 99.8 /100 | #51 | Exceptional 97.8% |
| Australians | 99.8 /100 | #52 | Exceptional 97.8% |