Immigrants from Guyana vs Romanian High School Diploma

COMPARE

Immigrants from Guyana
Race
Ancestry
AfghanAfricanAlaska NativeAlaskan AthabascanAlbanianAleutAlsatianAmericanApacheArabArapahoArgentineanArmenianAssyrian/Chaldean/SyriacAustralianAustrianBahamianBangladeshiBarbadianBasqueBelgianBelizeanBermudanBhutaneseBlackfeetBolivianBrazilianBritishBritish West IndianBulgarianBurmeseCajunCambodianCanadianCape VerdeanCarpatho RusynCelticCentral AmericanCentral American IndianCherokeeCheyenneChickasawChileanChineseChippewaChoctawColombianColvilleComancheCosta RicanCreeCreekCroatianCrowCubanCypriotCzechCzechoslovakianDanishDelawareDominicanDutchDutch West IndianEastern EuropeanEcuadorianEgyptianEnglishEstonianEthiopianEuropeanFijianFilipinoFinnishFrenchFrench American IndianFrench CanadianGermanGerman RussianGhanaianGreekGuamanian/ChamorroGuatemalanGuyaneseHaitianHmongHonduranHopiHoumaHungarianIcelanderIndian (Asian)IndonesianInupiatIranianIraqiIrishIroquoisIsraeliItalianJamaicanJapaneseJordanianKenyanKiowaKoreanLaotianLatvianLebaneseLiberianLithuanianLumbeeLuxembourgerMacedonianMalaysianMalteseMarshalleseMenomineeMexicanMexican American IndianMongolianMoroccanNative HawaiianNavajoNepaleseNew ZealanderNicaraguanNigerianNorthern EuropeanNorwegianOkinawanOsageOttawaPaiutePakistaniPalestinianPanamanianParaguayanPennsylvania GermanPeruvianPimaPolishPortuguesePotawatomiPuebloPuerto RicanPuget Sound SalishRussianSalvadoranSamoanScandinavianScotch-IrishScottishSeminoleSenegaleseSerbianShoshoneSierra LeoneanSiouxSlavicSlovakSloveneSomaliSouth AfricanSouth AmericanSouth American IndianSoviet UnionSpaniardSpanishSpanish AmericanSpanish American IndianSri LankanSubsaharan AfricanSudaneseSwedishSwissSyrianTaiwaneseThaiTlingit-HaidaTohono O'OdhamTonganTrinidadian and TobagonianTsimshianTurkishU.S. Virgin IslanderUgandanUkrainianUruguayanUteVenezuelanVietnameseWelshWest IndianYakamaYaquiYugoslavianYumanYup'ikZimbabwean
Immigration
NonimmigrantsImmigrantsAfghanistanAfricaAlbaniaArgentinaArmeniaAsiaAustraliaAustriaBahamasBangladeshBarbadosBelarusBelgiumBelizeBoliviaBosnia and HerzegovinaBrazilBulgariaBurma/MyanmarCabo VerdeCambodiaCameroonCanadaCaribbeanCentral AmericaChileChinaColombiaCongoCosta RicaCroatiaCubaCzechoslovakiaDenmarkDominicaDominican RepublicEastern AfricaEastern AsiaEastern EuropeEcuadorEgyptEl SalvadorEnglandEritreaEthiopiaEuropeFijiFranceGermanyGhanaGreeceGrenadaGuatemalaGuyanaHaitiHondurasHong KongHungaryIndiaIndonesiaIranIraqIrelandIsraelItalyJamaicaJapanJordanKazakhstanKenyaKoreaKuwaitLaosLatin AmericaLatviaLebanonLiberiaLithuaniaMalaysiaMexicoMicronesiaMiddle AfricaMoldovaMoroccoNepalNetherlandsNicaraguaNigeriaNorth AmericaNorth MacedoniaNorthern AfricaNorthern EuropeNorwayOceaniaPakistanPanamaPeruPhilippinesPolandPortugalRomaniaRussiaSaudi ArabiaScotlandSenegalSerbiaSierra LeoneSingaporeSomaliaSouth AfricaSouth AmericaSouth Central AsiaSouth Eastern AsiaSouthern EuropeSpainSri LankaSt. Vincent and the GrenadinesSudanSwedenSwitzerlandSyriaTaiwanThailandTrinidad and TobagoTurkeyUgandaUkraineUruguayUzbekistanVenezuelaVietnamWest IndiesWestern AfricaWestern AsiaWestern EuropeYemenZaireZimbabweAzores
Romanian
Race
Ancestry
AfghanAfricanAlaska NativeAlaskan AthabascanAlbanianAleutAlsatianAmericanApacheArabArapahoArgentineanArmenianAssyrian/Chaldean/SyriacAustralianAustrianBahamianBangladeshiBarbadianBasqueBelgianBelizeanBermudanBhutaneseBlackfeetBolivianBrazilianBritishBritish West IndianBulgarianBurmeseCajunCambodianCanadianCape VerdeanCarpatho RusynCelticCentral AmericanCentral American IndianCherokeeCheyenneChickasawChileanChineseChippewaChoctawColombianColvilleComancheCosta RicanCreeCreekCroatianCrowCubanCypriotCzechCzechoslovakianDanishDelawareDominicanDutchDutch West IndianEastern EuropeanEcuadorianEgyptianEnglishEstonianEthiopianEuropeanFijianFilipinoFinnishFrenchFrench American IndianFrench CanadianGermanGerman RussianGhanaianGreekGuamanian/ChamorroGuatemalanGuyaneseHaitianHmongHonduranHopiHoumaHungarianIcelanderIndian (Asian)IndonesianInupiatIranianIraqiIrishIroquoisIsraeliItalianJamaicanJapaneseJordanianKenyanKiowaKoreanLaotianLatvianLebaneseLiberianLithuanianLumbeeLuxembourgerMacedonianMalaysianMalteseMarshalleseMenomineeMexicanMexican American IndianMongolianMoroccanNative HawaiianNavajoNepaleseNew ZealanderNicaraguanNigerianNorthern EuropeanNorwegianOkinawanOsageOttawaPaiutePakistaniPalestinianPanamanianParaguayanPennsylvania GermanPeruvianPimaPolishPortuguesePotawatomiPuebloPuerto RicanPuget Sound SalishRomanianRussianSalvadoranSamoanScandinavianScotch-IrishScottishSeminoleSenegaleseSerbianShoshoneSierra LeoneanSiouxSlavicSlovakSloveneSomaliSouth AfricanSouth AmericanSouth American IndianSoviet UnionSpaniardSpanishSpanish AmericanSpanish American IndianSri LankanSubsaharan AfricanSudaneseSwedishSwissSyrianTaiwaneseThaiTlingit-HaidaTohono O'OdhamTonganTrinidadian and TobagonianTsimshianTurkishU.S. Virgin IslanderUgandanUkrainianUruguayanUteVenezuelanVietnameseWelshWest IndianYakamaYaquiYugoslavianYumanYup'ikZimbabwean
Immigration
NonimmigrantsImmigrantsAfghanistanAfricaAlbaniaArgentinaArmeniaAsiaAustraliaAustriaBahamasBangladeshBarbadosBelarusBelgiumBelizeBoliviaBosnia and HerzegovinaBrazilBulgariaBurma/MyanmarCabo VerdeCambodiaCameroonCanadaCaribbeanCentral AmericaChileChinaColombiaCongoCosta RicaCroatiaCubaCzechoslovakiaDenmarkDominicaDominican RepublicEastern AfricaEastern AsiaEastern EuropeEcuadorEgyptEl SalvadorEnglandEritreaEthiopiaEuropeFijiFranceGermanyGhanaGreeceGrenadaGuatemalaHaitiHondurasHong KongHungaryIndiaIndonesiaIranIraqIrelandIsraelItalyJamaicaJapanJordanKazakhstanKenyaKoreaKuwaitLaosLatin AmericaLatviaLebanonLiberiaLithuaniaMalaysiaMexicoMicronesiaMiddle AfricaMoldovaMoroccoNepalNetherlandsNicaraguaNigeriaNorth AmericaNorth MacedoniaNorthern AfricaNorthern EuropeNorwayOceaniaPakistanPanamaPeruPhilippinesPolandPortugalRomaniaRussiaSaudi ArabiaScotlandSenegalSerbiaSierra LeoneSingaporeSomaliaSouth AfricaSouth AmericaSouth Central AsiaSouth Eastern AsiaSouthern EuropeSpainSri LankaSt. Vincent and the GrenadinesSudanSwedenSwitzerlandSyriaTaiwanThailandTrinidad and TobagoTurkeyUgandaUkraineUruguayUzbekistanVenezuelaVietnamWest IndiesWestern AfricaWestern AsiaWestern EuropeYemenZaireZimbabweAzores
High School Diploma
Income
Poverty
Unemployment
Labor Participation
Family Structure
Vehicle Availability
Education Level
Disability

High School Diploma Comparison

Immigrants from Guyana

Romanians

Tragic
Exceptional
85.3%
HIGH SCHOOL DIPLOMA
0.0/ 100
METRIC RATING
306th/ 347
METRIC RANK
90.7%
HIGH SCHOOL DIPLOMA
98.9/ 100
METRIC RATING
85th/ 347
METRIC RANK

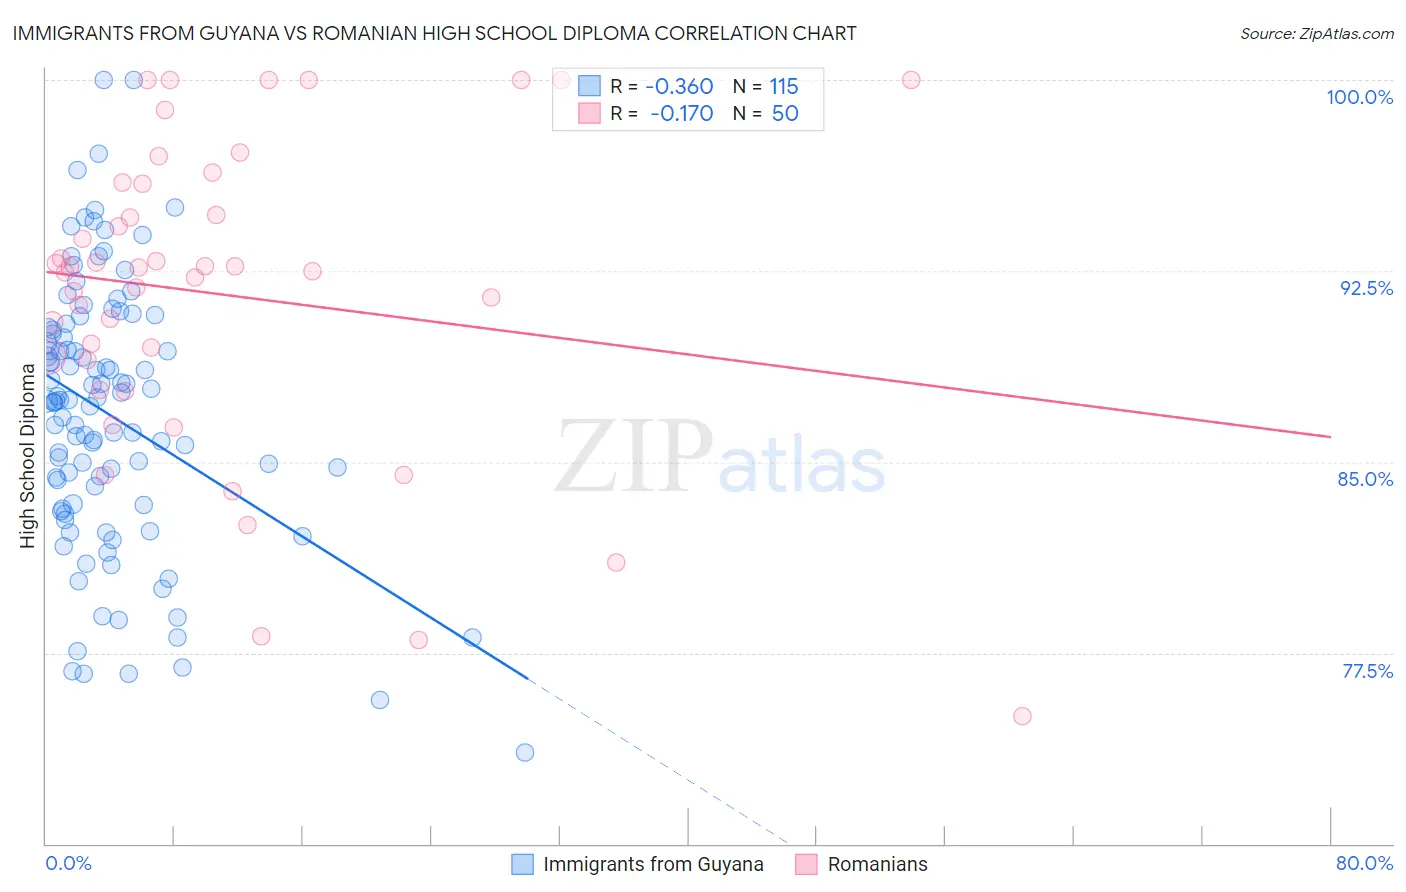
Immigrants from Guyana vs Romanian High School Diploma Correlation Chart

The statistical analysis conducted on geographies consisting of 183,673,461 people shows a mild negative correlation between the proportion of Immigrants from Guyana and percentage of population with at least high school diploma education in the United States with a correlation coefficient (R) of -0.360 and weighted average of 85.3%. Similarly, the statistical analysis conducted on geographies consisting of 377,905,122 people shows a poor negative correlation between the proportion of Romanians and percentage of population with at least high school diploma education in the United States with a correlation coefficient (R) of -0.170 and weighted average of 90.7%, a difference of 6.3%.
Immigrants from Guyana vs Romanian High School Diploma

High School Diploma Correlation Summary

MeasurementImmigrants from GuyanaRomanian
Minimum73.6%75.0%
Maximum100.0%100.0%
Range26.4%25.0%
Mean86.8%91.6%
Median87.4%92.6%
Interquartile 25% (IQ1)83.3%89.0%
Interquartile 75% (IQ3)90.2%95.9%
Interquartile Range (IQR)6.9%7.0%
Standard Deviation (Sample)5.2%6.1%
Standard Deviation (Population)5.2%6.0%

Similar Demographics by High School Diploma

Demographics Similar to Immigrants from Guyana by High School Diploma

In terms of high school diploma, the demographic groups most similar to Immigrants from Guyana are Nepalese (85.3%, a difference of 0.050%), Immigrants from Portugal (85.3%, a difference of 0.050%), Navajo (85.2%, a difference of 0.090%), Immigrants from Armenia (85.2%, a difference of 0.10%), and Immigrants from Dominica (85.2%, a difference of 0.11%).
DemographicsRating | RankHigh School Diploma
Guyanese
0.0
/100
|
#299
Tragic
85.5%
Immigrants | Bangladesh
0.0
/100
|
#300
Tragic
85.5%
Vietnamese
0.0
/100
|
#301
Tragic
85.4%
Immigrants | Haiti
0.0
/100
|
#302
Tragic
85.4%
Cubans
0.0
/100
|
#303
Tragic
85.4%
Nepalese
0.0
/100
|
#304
Tragic
85.3%
Immigrants | Portugal
0.0
/100
|
#305
Tragic
85.3%
Immigrants | Guyana
0.0
/100
|
#306
Tragic
85.3%
Navajo
0.0
/100
|
#307
Tragic
85.2%
Immigrants | Armenia
0.0
/100
|
#308
Tragic
85.2%
Immigrants | Dominica
0.0
/100
|
#309
Tragic
85.2%
Apache
0.0
/100
|
#310
Tragic
85.1%
Ecuadorians
0.0
/100
|
#311
Tragic
85.1%
Cape Verdeans
0.0
/100
|
#312
Tragic
85.1%
Immigrants | Ecuador
0.0
/100
|
#313
Tragic
84.8%

Demographics Similar to Romanians by High School Diploma

In terms of high school diploma, the demographic groups most similar to Romanians are Immigrants from Bulgaria (90.6%, a difference of 0.010%), Immigrants from Turkey (90.6%, a difference of 0.010%), Immigrants from France (90.6%, a difference of 0.030%), Canadian (90.6%, a difference of 0.050%), and Celtic (90.6%, a difference of 0.060%).
DemographicsRating | RankHigh School Diploma
Burmese
99.3
/100
|
#78
Exceptional
90.8%
Immigrants | Denmark
99.3
/100
|
#79
Exceptional
90.8%
Immigrants | England
99.3
/100
|
#80
Exceptional
90.8%
Immigrants | Switzerland
99.3
/100
|
#81
Exceptional
90.8%
Scotch-Irish
99.2
/100
|
#82
Exceptional
90.8%
Immigrants | Moldova
99.2
/100
|
#83
Exceptional
90.7%
Immigrants | Saudi Arabia
99.1
/100
|
#84
Exceptional
90.7%
Romanians
98.9
/100
|
#85
Exceptional
90.7%
Immigrants | Bulgaria
98.9
/100
|
#86
Exceptional
90.6%
Immigrants | Turkey
98.9
/100
|
#87
Exceptional
90.6%
Immigrants | France
98.8
/100
|
#88
Exceptional
90.6%
Canadians
98.7
/100
|
#89
Exceptional
90.6%
Celtics
98.7
/100
|
#90
Exceptional
90.6%
South Africans
98.6
/100
|
#91
Exceptional
90.6%
Swiss
98.6
/100
|
#92
Exceptional
90.6%