Immigrants from Guyana vs Nepalese 2nd Grade
COMPARE
Immigrants from Guyana
Nepalese
2nd Grade
2nd Grade Comparison
Immigrants from Guyana
Nepalese
96.7%
2ND GRADE
0.0/ 100
METRIC RATING
320th/ 347
METRIC RANK
96.1%
2ND GRADE
0.0/ 100
METRIC RATING
343rd/ 347
METRIC RANK
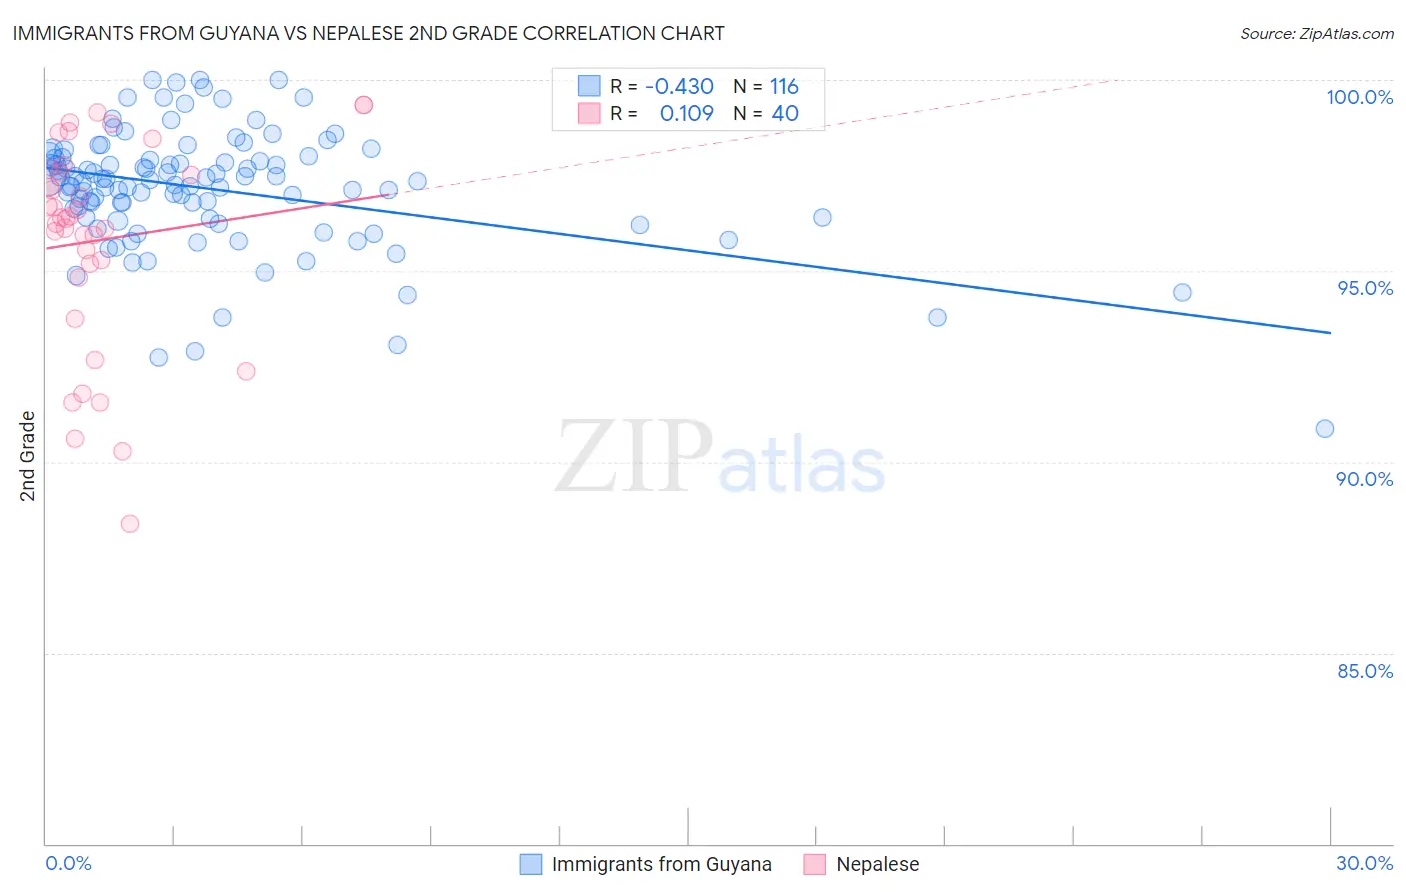
Immigrants from Guyana vs Nepalese 2nd Grade Correlation Chart
The statistical analysis conducted on geographies consisting of 183,746,342 people shows a moderate negative correlation between the proportion of Immigrants from Guyana and percentage of population with at least 2nd grade education in the United States with a correlation coefficient (R) of -0.430 and weighted average of 96.7%. Similarly, the statistical analysis conducted on geographies consisting of 24,521,755 people shows a poor positive correlation between the proportion of Nepalese and percentage of population with at least 2nd grade education in the United States with a correlation coefficient (R) of 0.109 and weighted average of 96.1%, a difference of 0.71%.
2nd Grade Correlation Summary
| Measurement | Immigrants from Guyana | Nepalese |
| Minimum | 90.9% | 88.4% |
| Maximum | 100.0% | 99.3% |
| Range | 9.1% | 11.0% |
| Mean | 97.1% | 95.8% |
| Median | 97.3% | 96.4% |
| Interquartile 25% (IQ1) | 96.4% | 95.0% |
| Interquartile 75% (IQ3) | 98.0% | 97.6% |
| Interquartile Range (IQR) | 1.6% | 2.6% |
| Standard Deviation (Sample) | 1.6% | 2.7% |
| Standard Deviation (Population) | 1.6% | 2.7% |
Similar Demographics by 2nd Grade
Demographics Similar to Immigrants from Guyana by 2nd Grade
In terms of 2nd grade, the demographic groups most similar to Immigrants from Guyana are Immigrants from Burma/Myanmar (96.7%, a difference of 0.0%), Honduran (96.7%, a difference of 0.010%), Immigrants from Laos (96.7%, a difference of 0.010%), Indonesian (96.7%, a difference of 0.010%), and Immigrants from Nicaragua (96.7%, a difference of 0.010%).
| Demographics | Rating | Rank | 2nd Grade |
| Hispanics or Latinos | 0.0 /100 | #313 | Tragic 96.8% |
| Immigrants | Ecuador | 0.0 /100 | #314 | Tragic 96.8% |
| Immigrants | Belize | 0.0 /100 | #315 | Tragic 96.8% |
| Hondurans | 0.0 /100 | #316 | Tragic 96.7% |
| Immigrants | Laos | 0.0 /100 | #317 | Tragic 96.7% |
| Indonesians | 0.0 /100 | #318 | Tragic 96.7% |
| Immigrants | Nicaragua | 0.0 /100 | #319 | Tragic 96.7% |
| Immigrants | Guyana | 0.0 /100 | #320 | Tragic 96.7% |
| Immigrants | Burma/Myanmar | 0.0 /100 | #321 | Tragic 96.7% |
| Immigrants | Bangladesh | 0.0 /100 | #322 | Tragic 96.7% |
| Vietnamese | 0.0 /100 | #323 | Tragic 96.7% |
| Mexican American Indians | 0.0 /100 | #324 | Tragic 96.7% |
| Dominicans | 0.0 /100 | #325 | Tragic 96.6% |
| Immigrants | Honduras | 0.0 /100 | #326 | Tragic 96.6% |
| Immigrants | Vietnam | 0.0 /100 | #327 | Tragic 96.5% |
Demographics Similar to Nepalese by 2nd Grade
In terms of 2nd grade, the demographic groups most similar to Nepalese are Salvadoran (96.0%, a difference of 0.040%), Immigrants from Mexico (96.1%, a difference of 0.090%), Immigrants from Central America (96.2%, a difference of 0.11%), Immigrants from Guatemala (96.2%, a difference of 0.13%), and Immigrants from El Salvador (95.9%, a difference of 0.20%).
| Demographics | Rating | Rank | 2nd Grade |
| Immigrants | Dominican Republic | 0.0 /100 | #333 | Tragic 96.4% |
| Central Americans | 0.0 /100 | #334 | Tragic 96.4% |
| Yakama | 0.0 /100 | #335 | Tragic 96.4% |
| Immigrants | Fiji | 0.0 /100 | #336 | Tragic 96.4% |
| Immigrants | Cambodia | 0.0 /100 | #337 | Tragic 96.4% |
| Immigrants | Cabo Verde | 0.0 /100 | #338 | Tragic 96.3% |
| Guatemalans | 0.0 /100 | #339 | Tragic 96.3% |
| Immigrants | Guatemala | 0.0 /100 | #340 | Tragic 96.2% |
| Immigrants | Central America | 0.0 /100 | #341 | Tragic 96.2% |
| Immigrants | Mexico | 0.0 /100 | #342 | Tragic 96.1% |
| Nepalese | 0.0 /100 | #343 | Tragic 96.1% |
| Salvadorans | 0.0 /100 | #344 | Tragic 96.0% |
| Immigrants | El Salvador | 0.0 /100 | #345 | Tragic 95.9% |
| Immigrants | Yemen | 0.0 /100 | #346 | Tragic 95.7% |
| Spanish American Indians | 0.0 /100 | #347 | Tragic 95.6% |