Immigrants from Guyana vs Cuban 4th Grade
COMPARE
Immigrants from Guyana
Cuban
4th Grade
4th Grade Comparison
Immigrants from Guyana
Cubans
96.3%
4TH GRADE
0.0/ 100
METRIC RATING
309th/ 347
METRIC RANK
96.9%
4TH GRADE
0.2/ 100
METRIC RATING
270th/ 347
METRIC RANK
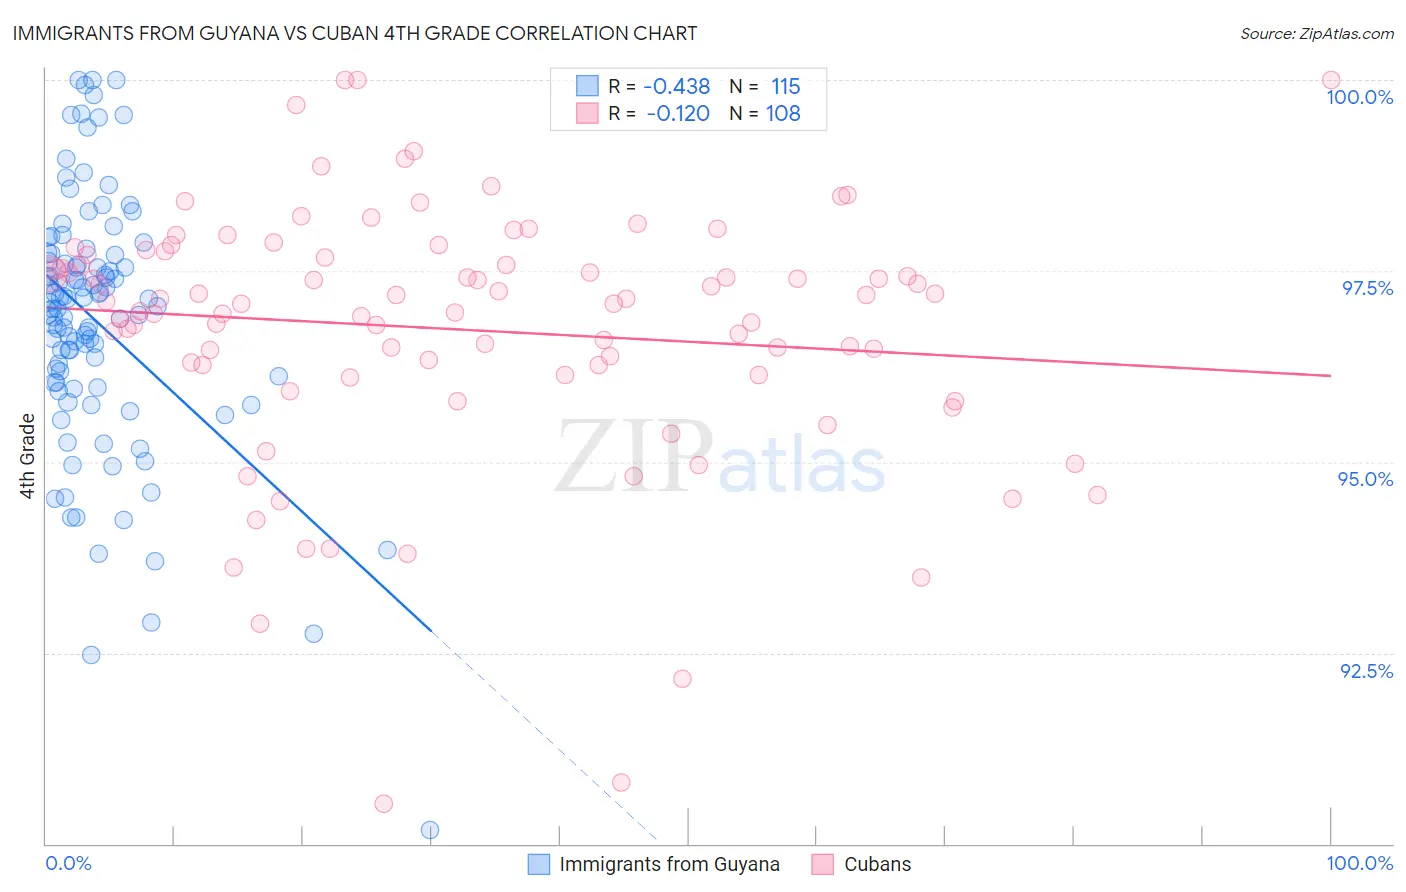
Immigrants from Guyana vs Cuban 4th Grade Correlation Chart
The statistical analysis conducted on geographies consisting of 183,673,461 people shows a moderate negative correlation between the proportion of Immigrants from Guyana and percentage of population with at least 4th grade education in the United States with a correlation coefficient (R) of -0.438 and weighted average of 96.3%. Similarly, the statistical analysis conducted on geographies consisting of 449,326,865 people shows a poor negative correlation between the proportion of Cubans and percentage of population with at least 4th grade education in the United States with a correlation coefficient (R) of -0.120 and weighted average of 96.9%, a difference of 0.63%.
4th Grade Correlation Summary
| Measurement | Immigrants from Guyana | Cuban |
| Minimum | 90.2% | 90.5% |
| Maximum | 100.0% | 100.0% |
| Range | 9.8% | 9.5% |
| Mean | 96.8% | 96.7% |
| Median | 97.0% | 97.1% |
| Interquartile 25% (IQ1) | 96.0% | 96.2% |
| Interquartile 75% (IQ3) | 97.7% | 97.7% |
| Interquartile Range (IQR) | 1.7% | 1.5% |
| Standard Deviation (Sample) | 1.7% | 1.7% |
| Standard Deviation (Population) | 1.7% | 1.7% |
Similar Demographics by 4th Grade
Demographics Similar to Immigrants from Guyana by 4th Grade
In terms of 4th grade, the demographic groups most similar to Immigrants from Guyana are Immigrants from Laos (96.3%, a difference of 0.0%), Immigrants from Haiti (96.3%, a difference of 0.010%), Immigrants from Burma/Myanmar (96.3%, a difference of 0.020%), Sri Lankan (96.4%, a difference of 0.040%), and Immigrants from Caribbean (96.4%, a difference of 0.050%).
| Demographics | Rating | Rank | 4th Grade |
| Immigrants | Cuba | 0.0 /100 | #302 | Tragic 96.4% |
| Guyanese | 0.0 /100 | #303 | Tragic 96.4% |
| Ecuadorians | 0.0 /100 | #304 | Tragic 96.4% |
| Immigrants | Caribbean | 0.0 /100 | #305 | Tragic 96.4% |
| Sri Lankans | 0.0 /100 | #306 | Tragic 96.4% |
| Immigrants | Haiti | 0.0 /100 | #307 | Tragic 96.3% |
| Immigrants | Laos | 0.0 /100 | #308 | Tragic 96.3% |
| Immigrants | Guyana | 0.0 /100 | #309 | Tragic 96.3% |
| Immigrants | Burma/Myanmar | 0.0 /100 | #310 | Tragic 96.3% |
| Immigrants | Bangladesh | 0.0 /100 | #311 | Tragic 96.2% |
| Cape Verdeans | 0.0 /100 | #312 | Tragic 96.2% |
| Indonesians | 0.0 /100 | #313 | Tragic 96.2% |
| Vietnamese | 0.0 /100 | #314 | Tragic 96.2% |
| Nicaraguans | 0.0 /100 | #315 | Tragic 96.2% |
| Immigrants | Ecuador | 0.0 /100 | #316 | Tragic 96.2% |
Demographics Similar to Cubans by 4th Grade
In terms of 4th grade, the demographic groups most similar to Cubans are Immigrants from Peru (96.9%, a difference of 0.010%), Fijian (96.9%, a difference of 0.010%), Immigrants from Uzbekistan (96.9%, a difference of 0.020%), Immigrants from Cameroon (96.9%, a difference of 0.020%), and Trinidadian and Tobagonian (96.9%, a difference of 0.030%).
| Demographics | Rating | Rank | 4th Grade |
| Immigrants | Jamaica | 0.3 /100 | #263 | Tragic 97.0% |
| Taiwanese | 0.3 /100 | #264 | Tragic 97.0% |
| Armenians | 0.3 /100 | #265 | Tragic 97.0% |
| Immigrants | China | 0.3 /100 | #266 | Tragic 97.0% |
| Immigrants | Nigeria | 0.3 /100 | #267 | Tragic 97.0% |
| Ghanaians | 0.2 /100 | #268 | Tragic 97.0% |
| Immigrants | Uzbekistan | 0.2 /100 | #269 | Tragic 96.9% |
| Cubans | 0.2 /100 | #270 | Tragic 96.9% |
| Immigrants | Peru | 0.1 /100 | #271 | Tragic 96.9% |
| Fijians | 0.1 /100 | #272 | Tragic 96.9% |
| Immigrants | Cameroon | 0.1 /100 | #273 | Tragic 96.9% |
| Trinidadians and Tobagonians | 0.1 /100 | #274 | Tragic 96.9% |
| Immigrants | Ghana | 0.1 /100 | #275 | Tragic 96.9% |
| Yaqui | 0.1 /100 | #276 | Tragic 96.9% |
| Immigrants | Western Africa | 0.1 /100 | #277 | Tragic 96.9% |