Immigrants from Guyana vs Chilean 11th Grade
COMPARE
Immigrants from Guyana
Chilean
11th Grade
11th Grade Comparison
Immigrants from Guyana
Chileans
89.7%
11TH GRADE
0.0/ 100
METRIC RATING
302nd/ 347
METRIC RANK
92.9%
11TH GRADE
83.0/ 100
METRIC RATING
141st/ 347
METRIC RANK
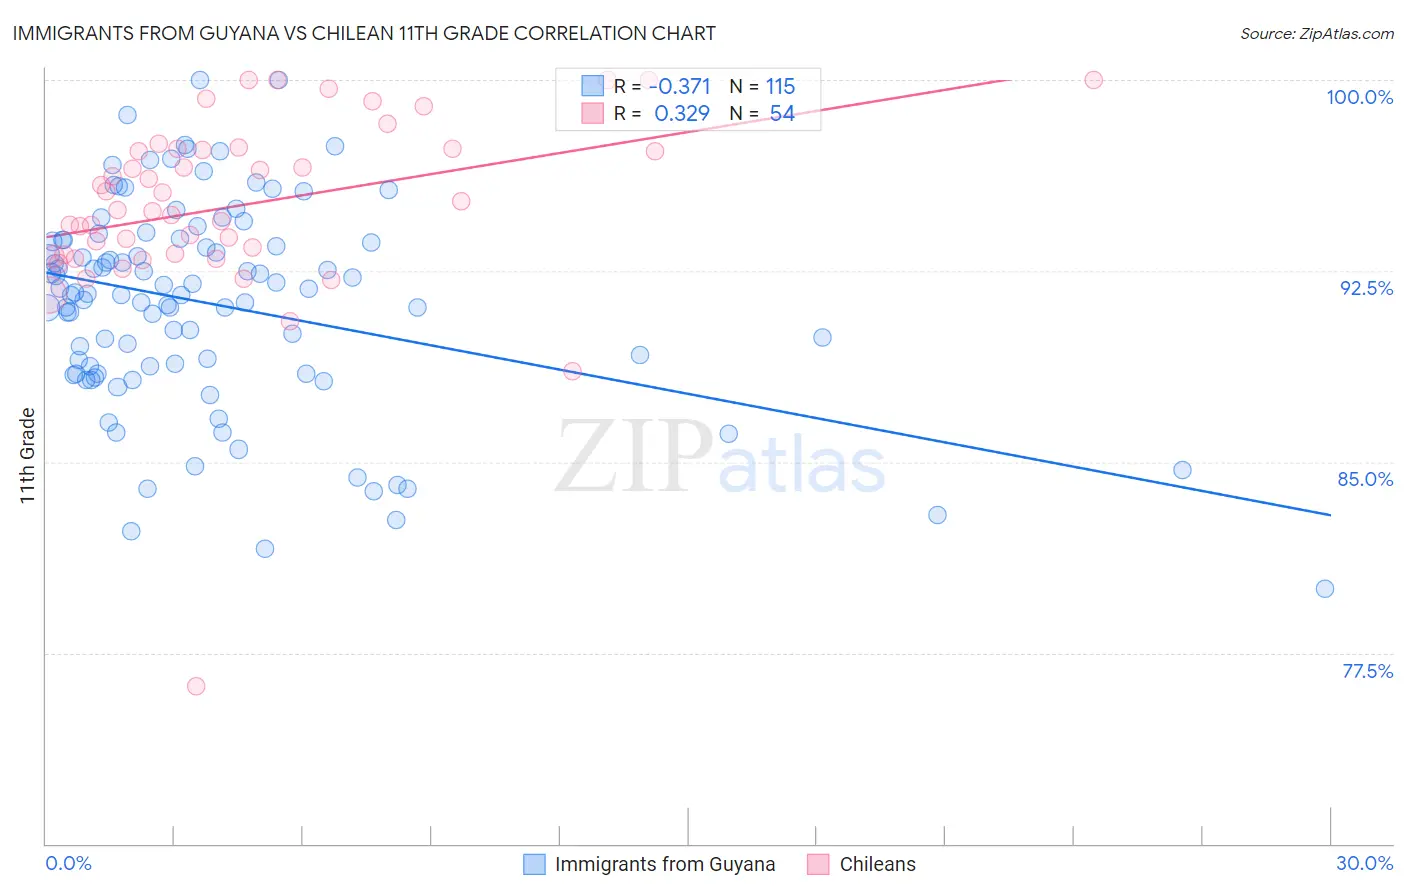
Immigrants from Guyana vs Chilean 11th Grade Correlation Chart
The statistical analysis conducted on geographies consisting of 183,673,461 people shows a mild negative correlation between the proportion of Immigrants from Guyana and percentage of population with at least 11th grade education in the United States with a correlation coefficient (R) of -0.371 and weighted average of 89.7%. Similarly, the statistical analysis conducted on geographies consisting of 256,683,580 people shows a mild positive correlation between the proportion of Chileans and percentage of population with at least 11th grade education in the United States with a correlation coefficient (R) of 0.329 and weighted average of 92.9%, a difference of 3.5%.
11th Grade Correlation Summary
| Measurement | Immigrants from Guyana | Chilean |
| Minimum | 80.0% | 76.2% |
| Maximum | 100.0% | 100.0% |
| Range | 20.0% | 23.8% |
| Mean | 91.2% | 95.1% |
| Median | 91.6% | 95.1% |
| Interquartile 25% (IQ1) | 88.5% | 93.1% |
| Interquartile 75% (IQ3) | 93.7% | 97.3% |
| Interquartile Range (IQR) | 5.2% | 4.2% |
| Standard Deviation (Sample) | 4.1% | 3.8% |
| Standard Deviation (Population) | 4.0% | 3.7% |
Similar Demographics by 11th Grade
Demographics Similar to Immigrants from Guyana by 11th Grade
In terms of 11th grade, the demographic groups most similar to Immigrants from Guyana are Immigrants (89.7%, a difference of 0.010%), Yuman (89.7%, a difference of 0.010%), Immigrants from Cambodia (89.6%, a difference of 0.090%), Ecuadorian (89.6%, a difference of 0.14%), and Guyanese (89.9%, a difference of 0.19%).
| Demographics | Rating | Rank | 11th Grade |
| Immigrants | Vietnam | 0.0 /100 | #295 | Tragic 90.0% |
| Fijians | 0.0 /100 | #296 | Tragic 90.0% |
| Navajo | 0.0 /100 | #297 | Tragic 90.0% |
| Immigrants | Fiji | 0.0 /100 | #298 | Tragic 89.9% |
| Japanese | 0.0 /100 | #299 | Tragic 89.9% |
| Immigrants | Haiti | 0.0 /100 | #300 | Tragic 89.9% |
| Guyanese | 0.0 /100 | #301 | Tragic 89.9% |
| Immigrants | Guyana | 0.0 /100 | #302 | Tragic 89.7% |
| Immigrants | Immigrants | 0.0 /100 | #303 | Tragic 89.7% |
| Yuman | 0.0 /100 | #304 | Tragic 89.7% |
| Immigrants | Cambodia | 0.0 /100 | #305 | Tragic 89.6% |
| Ecuadorians | 0.0 /100 | #306 | Tragic 89.6% |
| Immigrants | Dominica | 0.0 /100 | #307 | Tragic 89.5% |
| Nepalese | 0.0 /100 | #308 | Tragic 89.5% |
| Immigrants | Bangladesh | 0.0 /100 | #309 | Tragic 89.5% |
Demographics Similar to Chileans by 11th Grade
In terms of 11th grade, the demographic groups most similar to Chileans are Venezuelan (92.9%, a difference of 0.010%), Crow (92.9%, a difference of 0.020%), Kenyan (92.9%, a difference of 0.020%), Ugandan (92.9%, a difference of 0.030%), and Immigrants from Brazil (92.9%, a difference of 0.040%).
| Demographics | Rating | Rank | 11th Grade |
| Delaware | 87.3 /100 | #134 | Excellent 93.0% |
| Immigrants | Italy | 86.6 /100 | #135 | Excellent 92.9% |
| Cree | 85.9 /100 | #136 | Excellent 92.9% |
| Arabs | 85.4 /100 | #137 | Excellent 92.9% |
| Immigrants | Brazil | 85.1 /100 | #138 | Excellent 92.9% |
| Crow | 84.1 /100 | #139 | Excellent 92.9% |
| Venezuelans | 83.4 /100 | #140 | Excellent 92.9% |
| Chileans | 83.0 /100 | #141 | Excellent 92.9% |
| Kenyans | 82.0 /100 | #142 | Excellent 92.9% |
| Ugandans | 81.4 /100 | #143 | Excellent 92.9% |
| Assyrians/Chaldeans/Syriacs | 80.5 /100 | #144 | Excellent 92.8% |
| Pakistanis | 79.6 /100 | #145 | Good 92.8% |
| Iroquois | 79.1 /100 | #146 | Good 92.8% |
| Immigrants | Kenya | 78.7 /100 | #147 | Good 92.8% |
| Hmong | 78.6 /100 | #148 | Good 92.8% |