Immigrants from Guatemala vs Mongolian Kindergarten
COMPARE
Immigrants from Guatemala
Mongolian
Kindergarten
Kindergarten Comparison
Immigrants from Guatemala
Mongolians
96.4%
KINDERGARTEN
0.0/ 100
METRIC RATING
339th/ 347
METRIC RANK
97.9%
KINDERGARTEN
28.9/ 100
METRIC RATING
195th/ 347
METRIC RANK
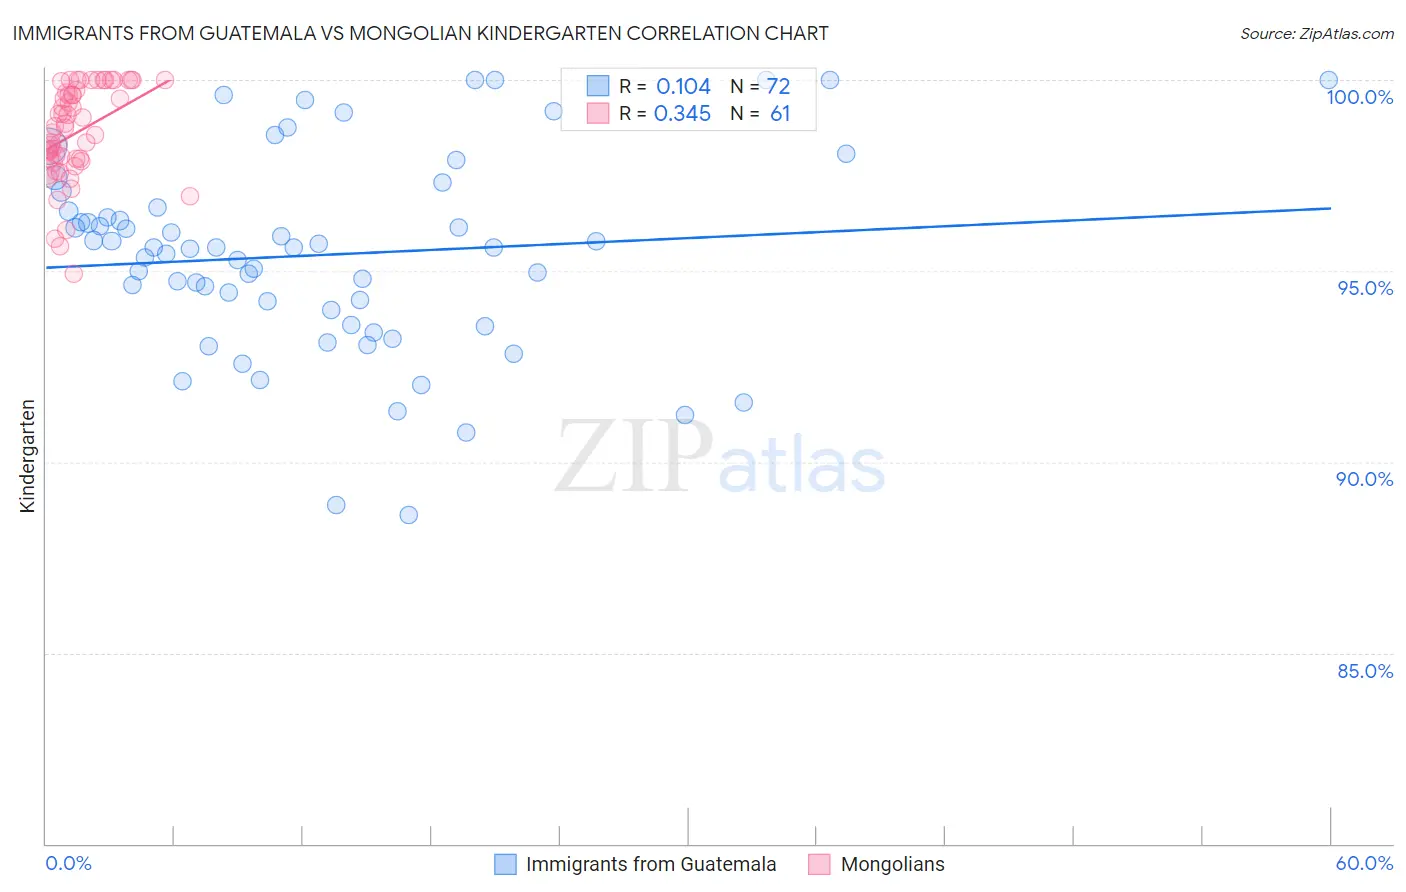
Immigrants from Guatemala vs Mongolian Kindergarten Correlation Chart
The statistical analysis conducted on geographies consisting of 377,282,938 people shows a poor positive correlation between the proportion of Immigrants from Guatemala and percentage of population with at least kindergarten education in the United States with a correlation coefficient (R) of 0.104 and weighted average of 96.4%. Similarly, the statistical analysis conducted on geographies consisting of 140,362,004 people shows a mild positive correlation between the proportion of Mongolians and percentage of population with at least kindergarten education in the United States with a correlation coefficient (R) of 0.345 and weighted average of 97.9%, a difference of 1.5%.
Kindergarten Correlation Summary
| Measurement | Immigrants from Guatemala | Mongolian |
| Minimum | 88.6% | 94.9% |
| Maximum | 100.0% | 100.0% |
| Range | 11.4% | 5.1% |
| Mean | 95.4% | 98.6% |
| Median | 95.6% | 98.8% |
| Interquartile 25% (IQ1) | 93.8% | 97.9% |
| Interquartile 75% (IQ3) | 96.6% | 99.7% |
| Interquartile Range (IQR) | 2.8% | 1.8% |
| Standard Deviation (Sample) | 2.6% | 1.2% |
| Standard Deviation (Population) | 2.6% | 1.2% |
Similar Demographics by Kindergarten
Demographics Similar to Immigrants from Guatemala by Kindergarten
In terms of kindergarten, the demographic groups most similar to Immigrants from Guatemala are Immigrants from Central America (96.4%, a difference of 0.030%), Immigrants from Cabo Verde (96.4%, a difference of 0.040%), Immigrants from Mexico (96.4%, a difference of 0.060%), Immigrants from Cambodia (96.5%, a difference of 0.080%), and Immigrants from Fiji (96.5%, a difference of 0.080%).
| Demographics | Rating | Rank | Kindergarten |
| Yakama | 0.0 /100 | #332 | Tragic 96.6% |
| Central Americans | 0.0 /100 | #333 | Tragic 96.6% |
| Immigrants | Dominican Republic | 0.0 /100 | #334 | Tragic 96.6% |
| Bangladeshis | 0.0 /100 | #335 | Tragic 96.6% |
| Guatemalans | 0.0 /100 | #336 | Tragic 96.5% |
| Immigrants | Cambodia | 0.0 /100 | #337 | Tragic 96.5% |
| Immigrants | Fiji | 0.0 /100 | #338 | Tragic 96.5% |
| Immigrants | Guatemala | 0.0 /100 | #339 | Tragic 96.4% |
| Immigrants | Central America | 0.0 /100 | #340 | Tragic 96.4% |
| Immigrants | Cabo Verde | 0.0 /100 | #341 | Tragic 96.4% |
| Immigrants | Mexico | 0.0 /100 | #342 | Tragic 96.4% |
| Salvadorans | 0.0 /100 | #343 | Tragic 96.3% |
| Nepalese | 0.0 /100 | #344 | Tragic 96.2% |
| Immigrants | El Salvador | 0.0 /100 | #345 | Tragic 96.2% |
| Immigrants | Yemen | 0.0 /100 | #346 | Tragic 95.9% |
Demographics Similar to Mongolians by Kindergarten
In terms of kindergarten, the demographic groups most similar to Mongolians are Black/African American (97.9%, a difference of 0.0%), Paraguayan (97.9%, a difference of 0.0%), Hawaiian (97.9%, a difference of 0.0%), Immigrants from Taiwan (97.9%, a difference of 0.010%), and Guamanian/Chamorro (97.9%, a difference of 0.010%).
| Demographics | Rating | Rank | Kindergarten |
| Arabs | 35.4 /100 | #188 | Fair 97.9% |
| Paiute | 34.7 /100 | #189 | Fair 97.9% |
| Panamanians | 33.3 /100 | #190 | Fair 97.9% |
| Immigrants | Taiwan | 30.7 /100 | #191 | Fair 97.9% |
| Blacks/African Americans | 29.9 /100 | #192 | Fair 97.9% |
| Paraguayans | 29.6 /100 | #193 | Fair 97.9% |
| Hawaiians | 29.3 /100 | #194 | Fair 97.9% |
| Mongolians | 28.9 /100 | #195 | Fair 97.9% |
| Guamanians/Chamorros | 26.2 /100 | #196 | Fair 97.9% |
| Immigrants | Kenya | 25.5 /100 | #197 | Fair 97.9% |
| Tohono O'odham | 24.6 /100 | #198 | Fair 97.9% |
| Immigrants | Egypt | 22.3 /100 | #199 | Fair 97.9% |
| Yuman | 21.6 /100 | #200 | Fair 97.9% |
| Immigrants | Lebanon | 20.9 /100 | #201 | Fair 97.9% |
| Immigrants | Ukraine | 19.1 /100 | #202 | Poor 97.8% |