Immigrants from Guatemala vs Immigrants from Austria 11th Grade
COMPARE
Immigrants from Guatemala
Immigrants from Austria
11th Grade
11th Grade Comparison
Immigrants from Guatemala
Immigrants from Austria
85.8%
11TH GRADE
0.0/ 100
METRIC RATING
342nd/ 347
METRIC RANK
94.1%
11TH GRADE
99.9/ 100
METRIC RATING
42nd/ 347
METRIC RANK
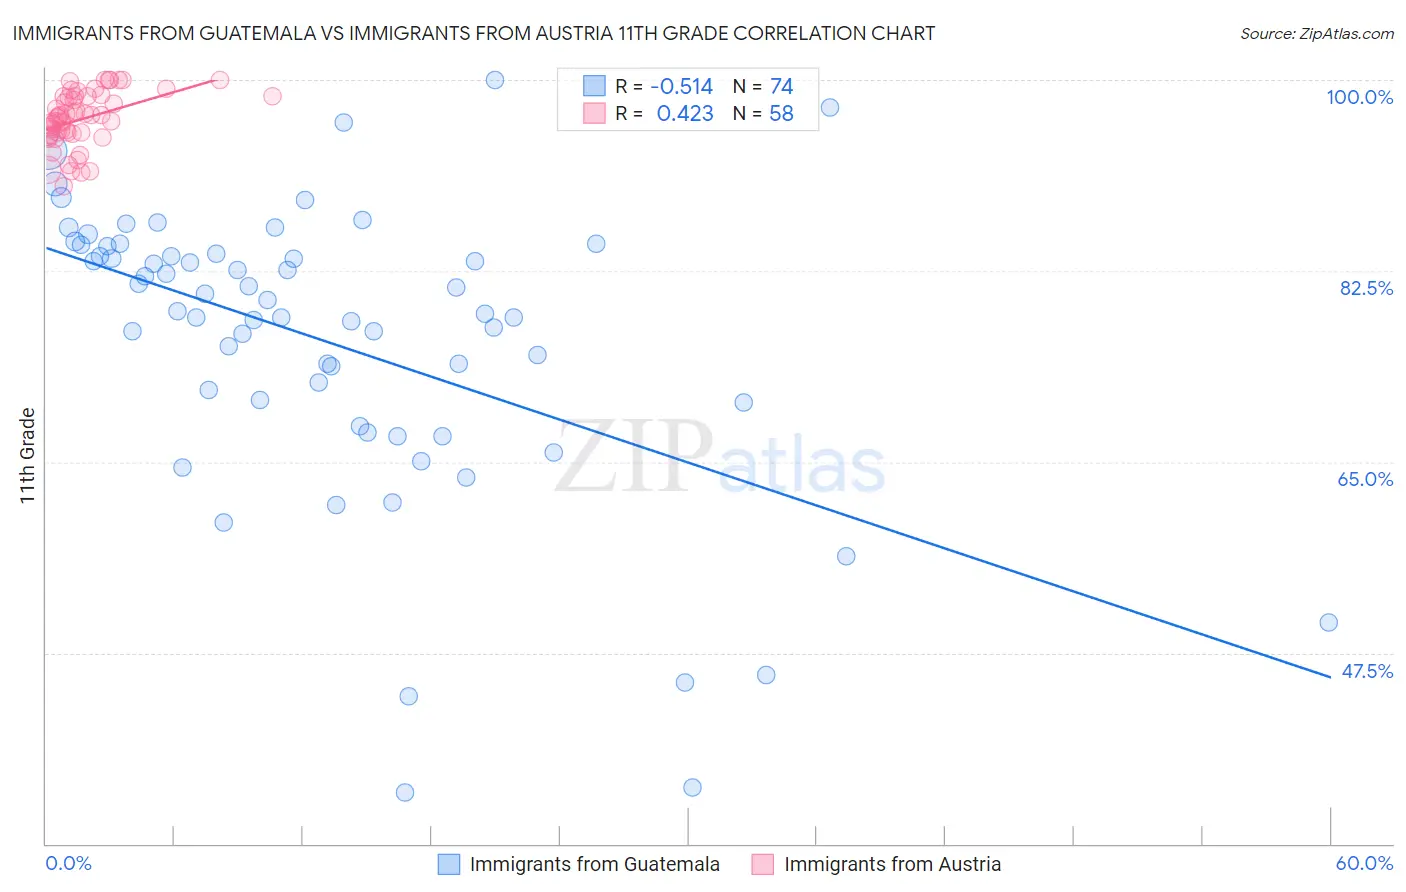
Immigrants from Guatemala vs Immigrants from Austria 11th Grade Correlation Chart
The statistical analysis conducted on geographies consisting of 377,286,142 people shows a substantial negative correlation between the proportion of Immigrants from Guatemala and percentage of population with at least 11th grade education in the United States with a correlation coefficient (R) of -0.514 and weighted average of 85.8%. Similarly, the statistical analysis conducted on geographies consisting of 167,973,618 people shows a moderate positive correlation between the proportion of Immigrants from Austria and percentage of population with at least 11th grade education in the United States with a correlation coefficient (R) of 0.423 and weighted average of 94.1%, a difference of 9.7%.
11th Grade Correlation Summary
| Measurement | Immigrants from Guatemala | Immigrants from Austria |
| Minimum | 34.7% | 90.3% |
| Maximum | 100.0% | 100.0% |
| Range | 65.3% | 9.7% |
| Mean | 76.0% | 96.4% |
| Median | 78.7% | 96.6% |
| Interquartile 25% (IQ1) | 70.4% | 95.1% |
| Interquartile 75% (IQ3) | 84.0% | 98.5% |
| Interquartile Range (IQR) | 13.6% | 3.5% |
| Standard Deviation (Sample) | 13.5% | 2.5% |
| Standard Deviation (Population) | 13.4% | 2.5% |
Similar Demographics by 11th Grade
Demographics Similar to Immigrants from Guatemala by 11th Grade
In terms of 11th grade, the demographic groups most similar to Immigrants from Guatemala are Mexican (86.1%, a difference of 0.33%), Salvadoran (86.2%, a difference of 0.39%), Immigrants from El Salvador (85.3%, a difference of 0.61%), Guatemalan (86.4%, a difference of 0.63%), and Yakama (85.0%, a difference of 1.0%).
| Demographics | Rating | Rank | 11th Grade |
| Immigrants | Yemen | 0.0 /100 | #333 | Tragic 87.1% |
| Houma | 0.0 /100 | #334 | Tragic 87.0% |
| Central Americans | 0.0 /100 | #335 | Tragic 86.9% |
| Immigrants | Dominican Republic | 0.0 /100 | #336 | Tragic 86.9% |
| Immigrants | Honduras | 0.0 /100 | #337 | Tragic 86.9% |
| Immigrants | Latin America | 0.0 /100 | #338 | Tragic 86.8% |
| Guatemalans | 0.0 /100 | #339 | Tragic 86.4% |
| Salvadorans | 0.0 /100 | #340 | Tragic 86.2% |
| Mexicans | 0.0 /100 | #341 | Tragic 86.1% |
| Immigrants | Guatemala | 0.0 /100 | #342 | Tragic 85.8% |
| Immigrants | El Salvador | 0.0 /100 | #343 | Tragic 85.3% |
| Yakama | 0.0 /100 | #344 | Tragic 85.0% |
| Immigrants | Central America | 0.0 /100 | #345 | Tragic 84.9% |
| Spanish American Indians | 0.0 /100 | #346 | Tragic 84.7% |
| Immigrants | Mexico | 0.0 /100 | #347 | Tragic 84.5% |
Demographics Similar to Immigrants from Austria by 11th Grade
In terms of 11th grade, the demographic groups most similar to Immigrants from Austria are Cypriot (94.1%, a difference of 0.010%), Greek (94.1%, a difference of 0.010%), Immigrants from Lithuania (94.1%, a difference of 0.020%), Thai (94.1%, a difference of 0.020%), and Immigrants from Ireland (94.1%, a difference of 0.020%).
| Demographics | Rating | Rank | 11th Grade |
| Immigrants | Singapore | 99.9 /100 | #35 | Exceptional 94.2% |
| Immigrants | Northern Europe | 99.9 /100 | #36 | Exceptional 94.2% |
| Northern Europeans | 99.9 /100 | #37 | Exceptional 94.2% |
| Hungarians | 99.9 /100 | #38 | Exceptional 94.2% |
| Immigrants | Lithuania | 99.9 /100 | #39 | Exceptional 94.1% |
| Thais | 99.9 /100 | #40 | Exceptional 94.1% |
| Cypriots | 99.9 /100 | #41 | Exceptional 94.1% |
| Immigrants | Austria | 99.9 /100 | #42 | Exceptional 94.1% |
| Greeks | 99.9 /100 | #43 | Exceptional 94.1% |
| Immigrants | Ireland | 99.9 /100 | #44 | Exceptional 94.1% |
| Australians | 99.9 /100 | #45 | Exceptional 94.1% |
| Serbians | 99.9 /100 | #46 | Exceptional 94.1% |
| Filipinos | 99.9 /100 | #47 | Exceptional 94.1% |
| Macedonians | 99.9 /100 | #48 | Exceptional 94.1% |
| Slavs | 99.9 /100 | #49 | Exceptional 94.1% |