Immigrants from Grenada vs Native/Alaskan College, 1 year or more
COMPARE
Immigrants from Grenada
Native/Alaskan
College, 1 year or more
College, 1 year or more Comparison
Immigrants from Grenada
Natives/Alaskans
54.4%
COLLEGE, 1 YEAR OR MORE
0.2/ 100
METRIC RATING
273rd/ 347
METRIC RANK
50.2%
COLLEGE, 1 YEAR OR MORE
0.0/ 100
METRIC RATING
330th/ 347
METRIC RANK
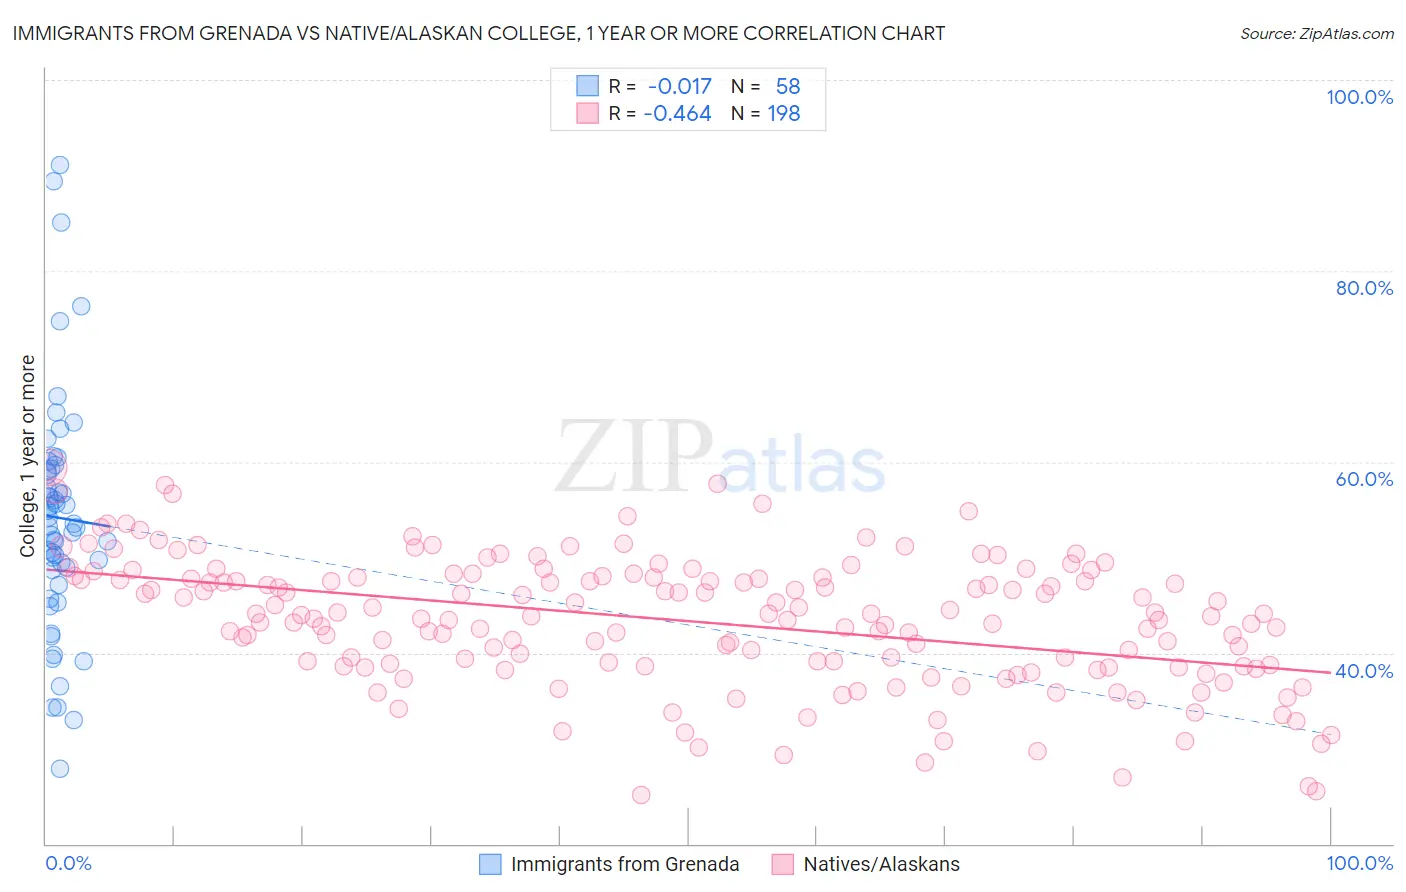
Immigrants from Grenada vs Native/Alaskan College, 1 year or more Correlation Chart
The statistical analysis conducted on geographies consisting of 67,201,096 people shows no correlation between the proportion of Immigrants from Grenada and percentage of population with at least college, 1 year or more education in the United States with a correlation coefficient (R) of -0.017 and weighted average of 54.4%. Similarly, the statistical analysis conducted on geographies consisting of 513,066,104 people shows a moderate negative correlation between the proportion of Natives/Alaskans and percentage of population with at least college, 1 year or more education in the United States with a correlation coefficient (R) of -0.464 and weighted average of 50.2%, a difference of 8.4%.
College, 1 year or more Correlation Summary
| Measurement | Immigrants from Grenada | Native/Alaskan |
| Minimum | 27.9% | 25.1% |
| Maximum | 91.1% | 59.4% |
| Range | 63.3% | 34.4% |
| Mean | 54.1% | 43.3% |
| Median | 53.4% | 43.9% |
| Interquartile 25% (IQ1) | 48.7% | 38.6% |
| Interquartile 75% (IQ3) | 59.3% | 47.9% |
| Interquartile Range (IQR) | 10.6% | 9.2% |
| Standard Deviation (Sample) | 12.5% | 6.8% |
| Standard Deviation (Population) | 12.4% | 6.8% |
Similar Demographics by College, 1 year or more
Demographics Similar to Immigrants from Grenada by College, 1 year or more
In terms of college, 1 year or more, the demographic groups most similar to Immigrants from Grenada are Comanche (54.4%, a difference of 0.040%), Belizean (54.4%, a difference of 0.040%), American (54.4%, a difference of 0.060%), Bahamian (54.5%, a difference of 0.080%), and Crow (54.5%, a difference of 0.11%).
| Demographics | Rating | Rank | College, 1 year or more |
| Potawatomi | 0.2 /100 | #266 | Tragic 54.6% |
| Blackfeet | 0.2 /100 | #267 | Tragic 54.6% |
| British West Indians | 0.2 /100 | #268 | Tragic 54.5% |
| Bangladeshis | 0.2 /100 | #269 | Tragic 54.5% |
| Crow | 0.2 /100 | #270 | Tragic 54.5% |
| Bahamians | 0.2 /100 | #271 | Tragic 54.5% |
| Comanche | 0.2 /100 | #272 | Tragic 54.4% |
| Immigrants | Grenada | 0.2 /100 | #273 | Tragic 54.4% |
| Belizeans | 0.2 /100 | #274 | Tragic 54.4% |
| Americans | 0.2 /100 | #275 | Tragic 54.4% |
| Shoshone | 0.2 /100 | #276 | Tragic 54.3% |
| Ecuadorians | 0.2 /100 | #277 | Tragic 54.3% |
| Immigrants | Jamaica | 0.1 /100 | #278 | Tragic 54.2% |
| Arapaho | 0.1 /100 | #279 | Tragic 54.1% |
| Cheyenne | 0.1 /100 | #280 | Tragic 54.1% |
Demographics Similar to Natives/Alaskans by College, 1 year or more
In terms of college, 1 year or more, the demographic groups most similar to Natives/Alaskans are Cape Verdean (50.3%, a difference of 0.22%), Immigrants from Yemen (50.0%, a difference of 0.35%), Dutch West Indian (50.5%, a difference of 0.62%), Menominee (50.6%, a difference of 0.74%), and Dominican (50.6%, a difference of 0.77%).
| Demographics | Rating | Rank | College, 1 year or more |
| Immigrants | Guatemala | 0.0 /100 | #323 | Tragic 50.7% |
| Immigrants | Cuba | 0.0 /100 | #324 | Tragic 50.7% |
| Immigrants | Latin America | 0.0 /100 | #325 | Tragic 50.7% |
| Dominicans | 0.0 /100 | #326 | Tragic 50.6% |
| Menominee | 0.0 /100 | #327 | Tragic 50.6% |
| Dutch West Indians | 0.0 /100 | #328 | Tragic 50.5% |
| Cape Verdeans | 0.0 /100 | #329 | Tragic 50.3% |
| Natives/Alaskans | 0.0 /100 | #330 | Tragic 50.2% |
| Immigrants | Yemen | 0.0 /100 | #331 | Tragic 50.0% |
| Mexicans | 0.0 /100 | #332 | Tragic 49.2% |
| Immigrants | Dominican Republic | 0.0 /100 | #333 | Tragic 49.1% |
| Lumbee | 0.0 /100 | #334 | Tragic 48.9% |
| Yuman | 0.0 /100 | #335 | Tragic 48.7% |
| Spanish American Indians | 0.0 /100 | #336 | Tragic 48.5% |
| Pennsylvania Germans | 0.0 /100 | #337 | Tragic 48.5% |