Immigrants from Grenada vs Hmong Associate's Degree
COMPARE
Immigrants from Grenada
Hmong
Associate's Degree
Associate's Degree Comparison
Immigrants from Grenada
Hmong
42.6%
ASSOCIATE'S DEGREE
1.3/ 100
METRIC RATING
239th/ 347
METRIC RANK
43.4%
ASSOCIATE'S DEGREE
3.2/ 100
METRIC RATING
228th/ 347
METRIC RANK
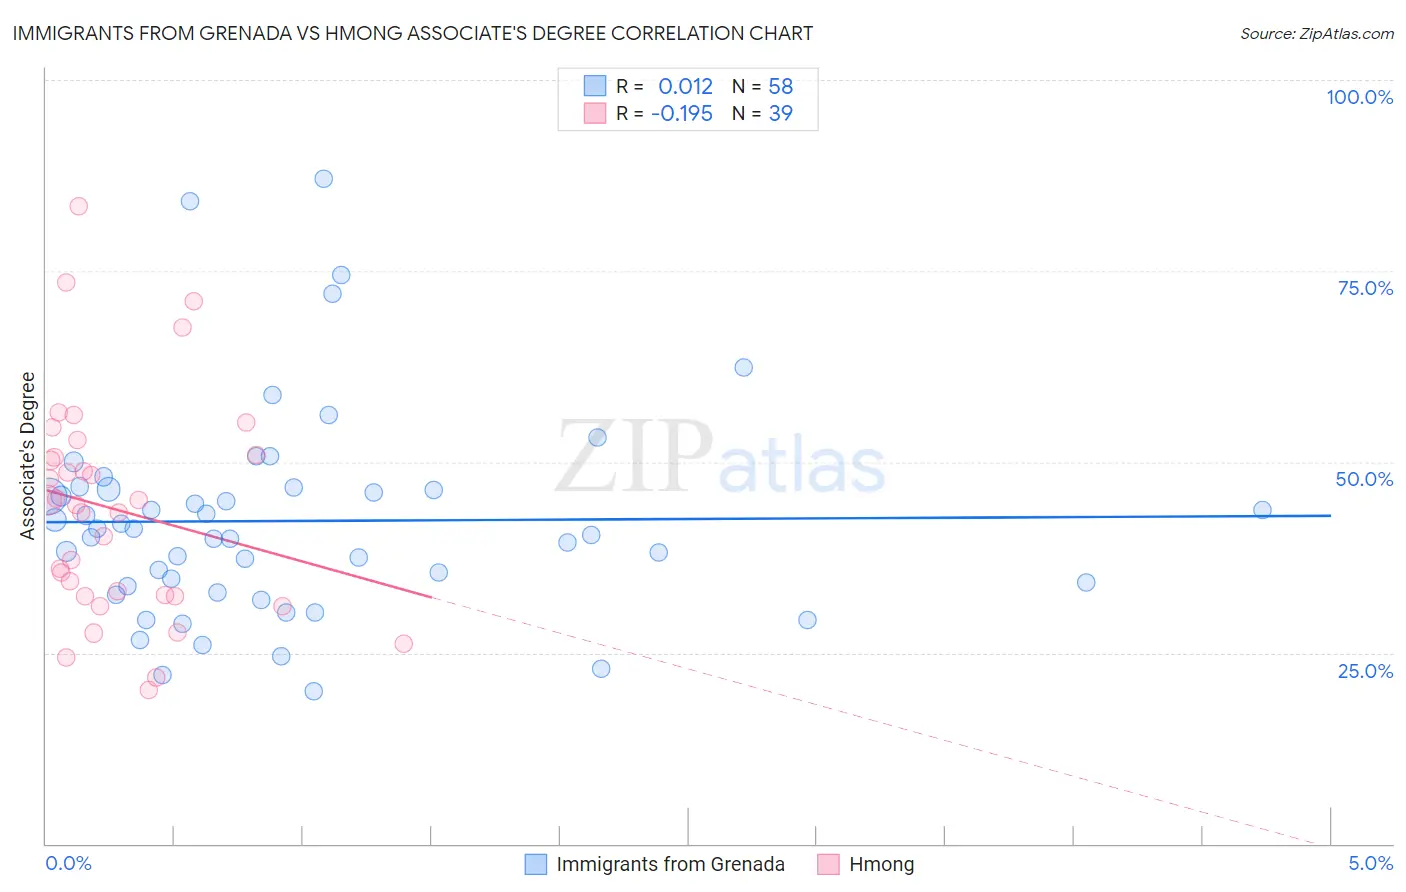
Immigrants from Grenada vs Hmong Associate's Degree Correlation Chart
The statistical analysis conducted on geographies consisting of 67,201,096 people shows no correlation between the proportion of Immigrants from Grenada and percentage of population with at least associate's degree education in the United States with a correlation coefficient (R) of 0.012 and weighted average of 42.6%. Similarly, the statistical analysis conducted on geographies consisting of 24,680,511 people shows a poor negative correlation between the proportion of Hmong and percentage of population with at least associate's degree education in the United States with a correlation coefficient (R) of -0.195 and weighted average of 43.4%, a difference of 1.9%.
Associate's Degree Correlation Summary
| Measurement | Immigrants from Grenada | Hmong |
| Minimum | 20.0% | 20.2% |
| Maximum | 87.1% | 83.4% |
| Range | 67.1% | 63.2% |
| Mean | 42.3% | 43.7% |
| Median | 40.8% | 44.4% |
| Interquartile 25% (IQ1) | 33.8% | 32.4% |
| Interquartile 75% (IQ3) | 46.4% | 50.9% |
| Interquartile Range (IQR) | 12.7% | 18.6% |
| Standard Deviation (Sample) | 13.7% | 14.5% |
| Standard Deviation (Population) | 13.5% | 14.3% |
Demographics Similar to Immigrants from Grenada and Hmong by Associate's Degree
In terms of associate's degree, the demographic groups most similar to Immigrants from Grenada are Cree (42.5%, a difference of 0.18%), Iroquois (42.8%, a difference of 0.51%), British West Indian (42.4%, a difference of 0.51%), Immigrants from West Indies (42.4%, a difference of 0.52%), and Guyanese (42.3%, a difference of 0.64%). Similarly, the demographic groups most similar to Hmong are Immigrants from Trinidad and Tobago (43.3%, a difference of 0.16%), Immigrants from Barbados (43.3%, a difference of 0.23%), Liberian (43.3%, a difference of 0.23%), Trinidadian and Tobagonian (43.6%, a difference of 0.44%), and Immigrants from Burma/Myanmar (43.7%, a difference of 0.62%).
| Demographics | Rating | Rank | Associate's Degree |
| Sub-Saharan Africans | 5.5 /100 | #223 | Tragic 43.9% |
| West Indians | 5.2 /100 | #224 | Tragic 43.8% |
| Guamanians/Chamorros | 4.8 /100 | #225 | Tragic 43.8% |
| Immigrants | Burma/Myanmar | 4.3 /100 | #226 | Tragic 43.7% |
| Trinidadians and Tobagonians | 4.0 /100 | #227 | Tragic 43.6% |
| Hmong | 3.2 /100 | #228 | Tragic 43.4% |
| Immigrants | Trinidad and Tobago | 3.0 /100 | #229 | Tragic 43.3% |
| Immigrants | Barbados | 2.9 /100 | #230 | Tragic 43.3% |
| Liberians | 2.9 /100 | #231 | Tragic 43.3% |
| Native Hawaiians | 2.3 /100 | #232 | Tragic 43.1% |
| Tongans | 2.2 /100 | #233 | Tragic 43.0% |
| Tlingit-Haida | 2.1 /100 | #234 | Tragic 43.0% |
| Ecuadorians | 2.0 /100 | #235 | Tragic 43.0% |
| Immigrants | St. Vincent and the Grenadines | 1.9 /100 | #236 | Tragic 42.9% |
| Immigrants | Nonimmigrants | 1.9 /100 | #237 | Tragic 42.9% |
| Iroquois | 1.7 /100 | #238 | Tragic 42.8% |
| Immigrants | Grenada | 1.3 /100 | #239 | Tragic 42.6% |
| Cree | 1.2 /100 | #240 | Tragic 42.5% |
| British West Indians | 1.0 /100 | #241 | Tragic 42.4% |
| Immigrants | West Indies | 1.0 /100 | #242 | Tragic 42.4% |
| Guyanese | 1.0 /100 | #243 | Tragic 42.3% |