Immigrants from Greece vs Immigrants from Bosnia and Herzegovina 3rd Grade
COMPARE
Immigrants from Greece
Immigrants from Bosnia and Herzegovina
3rd Grade
3rd Grade Comparison
Immigrants from Greece
Immigrants from Bosnia and Herzegovina
97.9%
3RD GRADE
79.5/ 100
METRIC RATING
145th/ 347
METRIC RANK
97.8%
3RD GRADE
56.2/ 100
METRIC RATING
164th/ 347
METRIC RANK
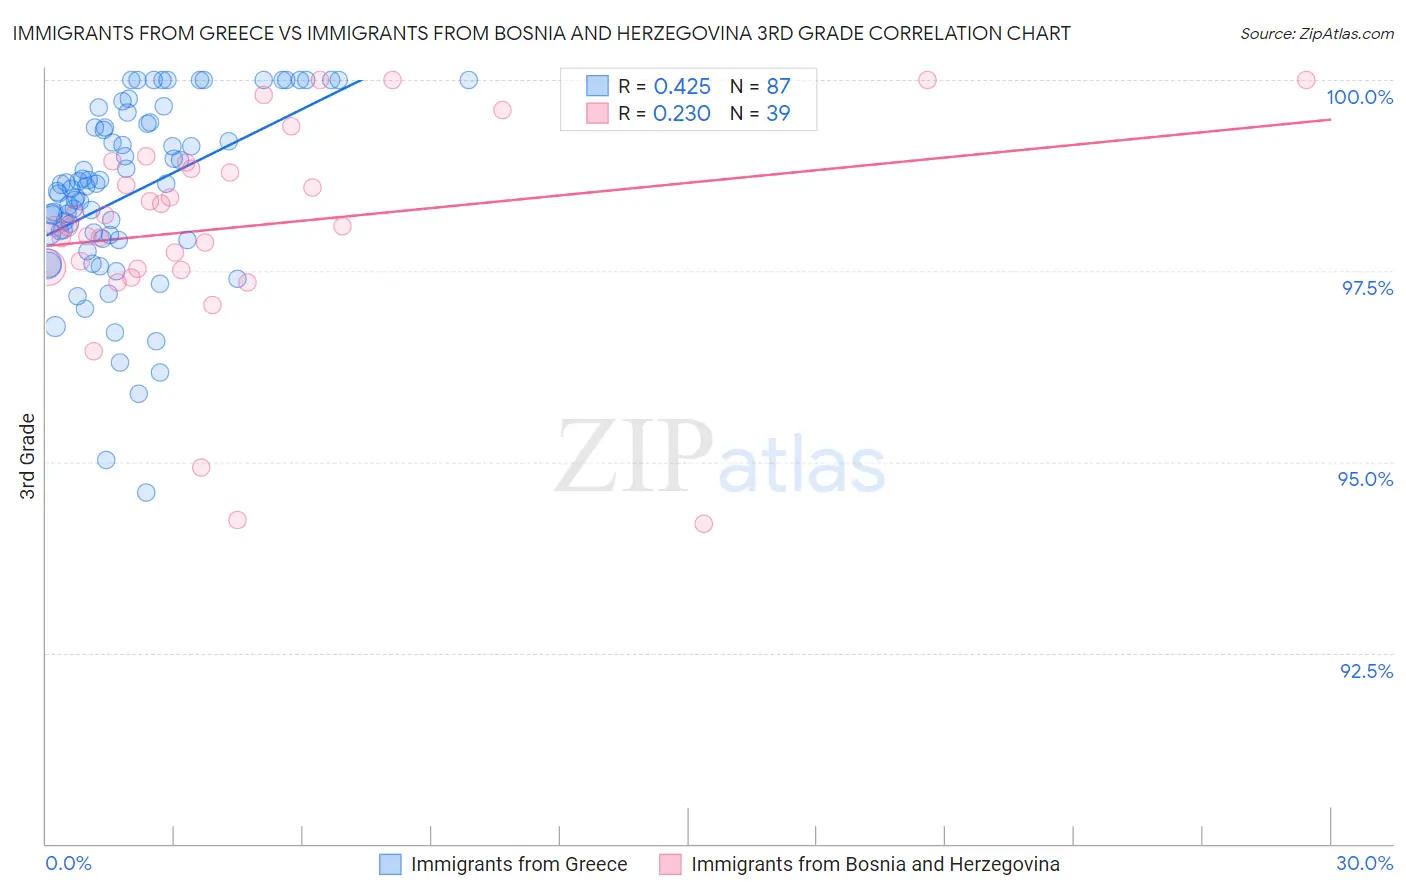
Immigrants from Greece vs Immigrants from Bosnia and Herzegovina 3rd Grade Correlation Chart
The statistical analysis conducted on geographies consisting of 216,879,847 people shows a moderate positive correlation between the proportion of Immigrants from Greece and percentage of population with at least 3rd grade education in the United States with a correlation coefficient (R) of 0.425 and weighted average of 97.9%. Similarly, the statistical analysis conducted on geographies consisting of 156,779,463 people shows a weak positive correlation between the proportion of Immigrants from Bosnia and Herzegovina and percentage of population with at least 3rd grade education in the United States with a correlation coefficient (R) of 0.230 and weighted average of 97.8%, a difference of 0.090%.
3rd Grade Correlation Summary
| Measurement | Immigrants from Greece | Immigrants from Bosnia and Herzegovina |
| Minimum | 94.6% | 94.2% |
| Maximum | 100.0% | 100.0% |
| Range | 5.4% | 5.8% |
| Mean | 98.5% | 98.1% |
| Median | 98.6% | 98.1% |
| Interquartile 25% (IQ1) | 97.9% | 97.5% |
| Interquartile 75% (IQ3) | 99.4% | 98.9% |
| Interquartile Range (IQR) | 1.5% | 1.4% |
| Standard Deviation (Sample) | 1.2% | 1.4% |
| Standard Deviation (Population) | 1.2% | 1.4% |
Demographics Similar to Immigrants from Greece and Immigrants from Bosnia and Herzegovina by 3rd Grade
In terms of 3rd grade, the demographic groups most similar to Immigrants from Greece are Burmese (97.9%, a difference of 0.0%), Alsatian (97.9%, a difference of 0.010%), Immigrants from Israel (97.9%, a difference of 0.010%), Immigrants from Moldova (97.9%, a difference of 0.010%), and Immigrants from North Macedonia (97.8%, a difference of 0.020%). Similarly, the demographic groups most similar to Immigrants from Bosnia and Herzegovina are Marshallese (97.8%, a difference of 0.0%), French American Indian (97.8%, a difference of 0.010%), Immigrants from Iran (97.8%, a difference of 0.010%), Albanian (97.8%, a difference of 0.010%), and Immigrants from Jordan (97.8%, a difference of 0.010%).
| Demographics | Rating | Rank | 3rd Grade |
| Burmese | 79.6 /100 | #144 | Good 97.9% |
| Immigrants | Greece | 79.5 /100 | #145 | Good 97.9% |
| Alsatians | 78.3 /100 | #146 | Good 97.9% |
| Immigrants | Israel | 77.3 /100 | #147 | Good 97.9% |
| Immigrants | Moldova | 77.1 /100 | #148 | Good 97.9% |
| Immigrants | North Macedonia | 74.5 /100 | #149 | Good 97.8% |
| Jordanians | 74.5 /100 | #150 | Good 97.8% |
| Soviet Union | 72.6 /100 | #151 | Good 97.8% |
| Immigrants | South Central Asia | 69.5 /100 | #152 | Good 97.8% |
| Apache | 68.5 /100 | #153 | Good 97.8% |
| Immigrants | Eastern Europe | 64.1 /100 | #154 | Good 97.8% |
| Bermudans | 62.6 /100 | #155 | Good 97.8% |
| Immigrants | Russia | 61.7 /100 | #156 | Good 97.8% |
| Immigrants | Italy | 61.2 /100 | #157 | Good 97.8% |
| Venezuelans | 60.9 /100 | #158 | Good 97.8% |
| French American Indians | 60.0 /100 | #159 | Average 97.8% |
| Immigrants | Iran | 59.1 /100 | #160 | Average 97.8% |
| Albanians | 58.8 /100 | #161 | Average 97.8% |
| Immigrants | Jordan | 57.9 /100 | #162 | Average 97.8% |
| Marshallese | 57.2 /100 | #163 | Average 97.8% |
| Immigrants | Bosnia and Herzegovina | 56.2 /100 | #164 | Average 97.8% |