Immigrants from Greece vs Creek Bachelor's Degree
COMPARE
Immigrants from Greece
Creek
Bachelor's Degree
Bachelor's Degree Comparison
Immigrants from Greece
Creek
44.5%
BACHELOR'S DEGREE
99.9/ 100
METRIC RATING
50th/ 347
METRIC RANK
28.9%
BACHELOR'S DEGREE
0.0/ 100
METRIC RATING
319th/ 347
METRIC RANK
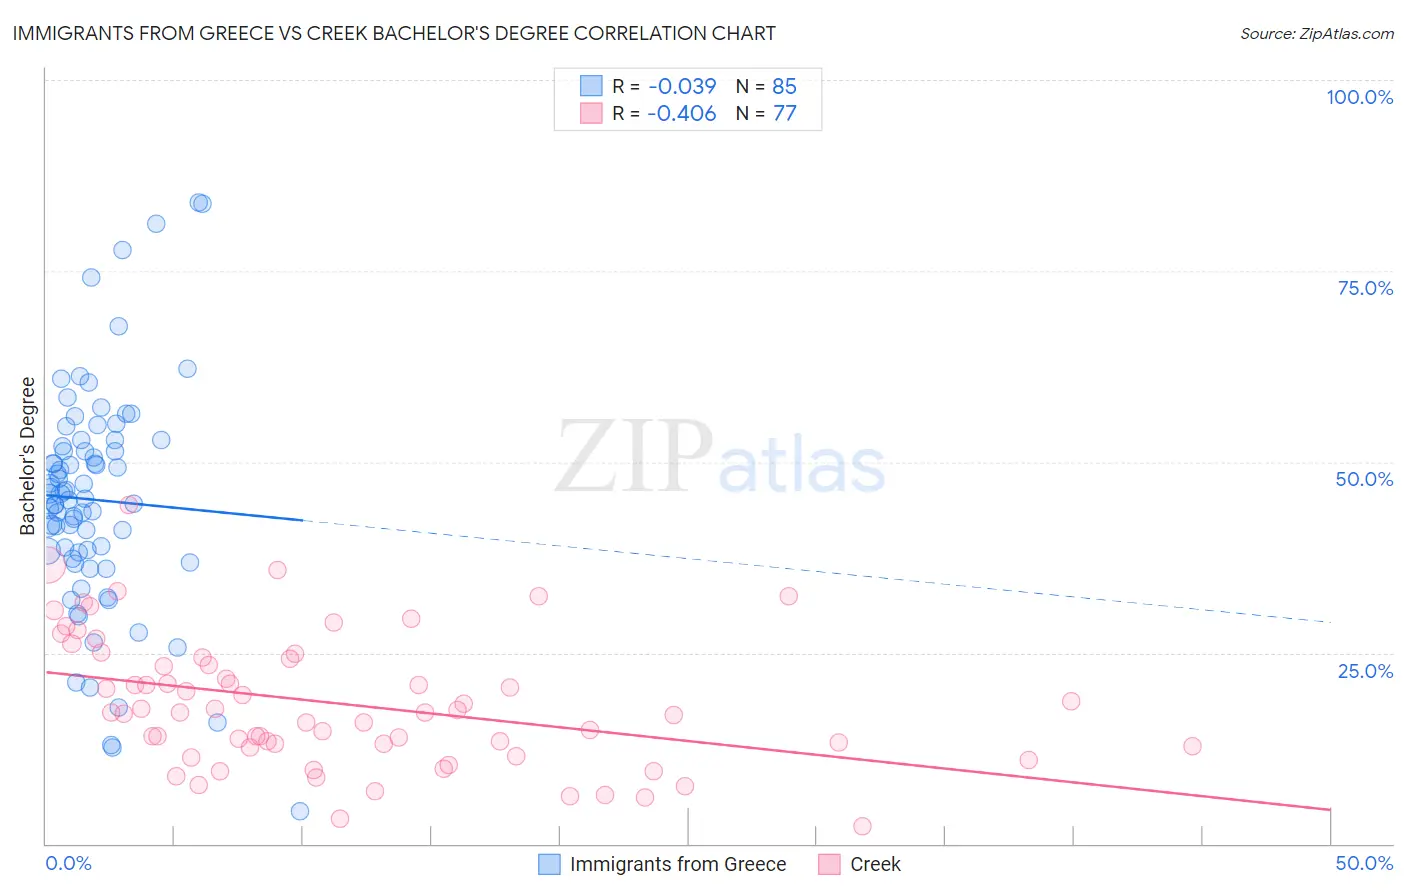
Immigrants from Greece vs Creek Bachelor's Degree Correlation Chart
The statistical analysis conducted on geographies consisting of 216,876,242 people shows no correlation between the proportion of Immigrants from Greece and percentage of population with at least bachelor's degree education in the United States with a correlation coefficient (R) of -0.039 and weighted average of 44.5%. Similarly, the statistical analysis conducted on geographies consisting of 178,478,956 people shows a moderate negative correlation between the proportion of Creek and percentage of population with at least bachelor's degree education in the United States with a correlation coefficient (R) of -0.406 and weighted average of 28.9%, a difference of 54.0%.
Bachelor's Degree Correlation Summary
| Measurement | Immigrants from Greece | Creek |
| Minimum | 4.3% | 2.3% |
| Maximum | 83.9% | 44.3% |
| Range | 79.6% | 42.0% |
| Mean | 45.0% | 18.4% |
| Median | 45.2% | 17.1% |
| Interquartile 25% (IQ1) | 37.8% | 12.7% |
| Interquartile 75% (IQ3) | 52.4% | 24.3% |
| Interquartile Range (IQR) | 14.6% | 11.6% |
| Standard Deviation (Sample) | 14.9% | 8.6% |
| Standard Deviation (Population) | 14.8% | 8.6% |
Similar Demographics by Bachelor's Degree
Demographics Similar to Immigrants from Greece by Bachelor's Degree
In terms of bachelor's degree, the demographic groups most similar to Immigrants from Greece are Immigrants from Norway (44.5%, a difference of 0.12%), Asian (44.4%, a difference of 0.14%), Bolivian (44.6%, a difference of 0.24%), Estonian (44.6%, a difference of 0.24%), and Immigrants from Bulgaria (44.6%, a difference of 0.28%).
| Demographics | Rating | Rank | Bachelor's Degree |
| Immigrants | South Africa | 99.9 /100 | #43 | Exceptional 44.8% |
| Immigrants | Lithuania | 99.9 /100 | #44 | Exceptional 44.6% |
| Immigrants | Kuwait | 99.9 /100 | #45 | Exceptional 44.6% |
| Immigrants | Bulgaria | 99.9 /100 | #46 | Exceptional 44.6% |
| Bolivians | 99.9 /100 | #47 | Exceptional 44.6% |
| Estonians | 99.9 /100 | #48 | Exceptional 44.6% |
| Immigrants | Norway | 99.9 /100 | #49 | Exceptional 44.5% |
| Immigrants | Greece | 99.9 /100 | #50 | Exceptional 44.5% |
| Asians | 99.9 /100 | #51 | Exceptional 44.4% |
| Immigrants | Spain | 99.9 /100 | #52 | Exceptional 44.3% |
| Immigrants | Asia | 99.9 /100 | #53 | Exceptional 44.3% |
| Immigrants | Austria | 99.9 /100 | #54 | Exceptional 44.2% |
| Immigrants | Bolivia | 99.9 /100 | #55 | Exceptional 44.2% |
| Immigrants | Serbia | 99.9 /100 | #56 | Exceptional 44.1% |
| Paraguayans | 99.9 /100 | #57 | Exceptional 44.0% |
Demographics Similar to Creek by Bachelor's Degree
In terms of bachelor's degree, the demographic groups most similar to Creek are Kiowa (28.8%, a difference of 0.040%), Alaskan Athabascan (28.8%, a difference of 0.13%), Tsimshian (28.8%, a difference of 0.35%), Yaqui (29.0%, a difference of 0.45%), and Fijian (28.7%, a difference of 0.48%).
| Demographics | Rating | Rank | Bachelor's Degree |
| Seminole | 0.0 /100 | #312 | Tragic 29.4% |
| Alaska Natives | 0.0 /100 | #313 | Tragic 29.4% |
| Shoshone | 0.0 /100 | #314 | Tragic 29.3% |
| Immigrants | Cabo Verde | 0.0 /100 | #315 | Tragic 29.2% |
| Sioux | 0.0 /100 | #316 | Tragic 29.1% |
| Colville | 0.0 /100 | #317 | Tragic 29.0% |
| Yaqui | 0.0 /100 | #318 | Tragic 29.0% |
| Creek | 0.0 /100 | #319 | Tragic 28.9% |
| Kiowa | 0.0 /100 | #320 | Tragic 28.8% |
| Alaskan Athabascans | 0.0 /100 | #321 | Tragic 28.8% |
| Tsimshian | 0.0 /100 | #322 | Tragic 28.8% |
| Fijians | 0.0 /100 | #323 | Tragic 28.7% |
| Dutch West Indians | 0.0 /100 | #324 | Tragic 28.5% |
| Pennsylvania Germans | 0.0 /100 | #325 | Tragic 28.4% |
| Apache | 0.0 /100 | #326 | Tragic 28.3% |