Immigrants from Greece vs Chilean Master's Degree
COMPARE
Immigrants from Greece
Chilean
Master's Degree
Master's Degree Comparison
Immigrants from Greece
Chileans
19.0%
MASTER'S DEGREE
100.0/ 100
METRIC RATING
43rd/ 347
METRIC RANK
16.9%
MASTER'S DEGREE
98.6/ 100
METRIC RATING
102nd/ 347
METRIC RANK
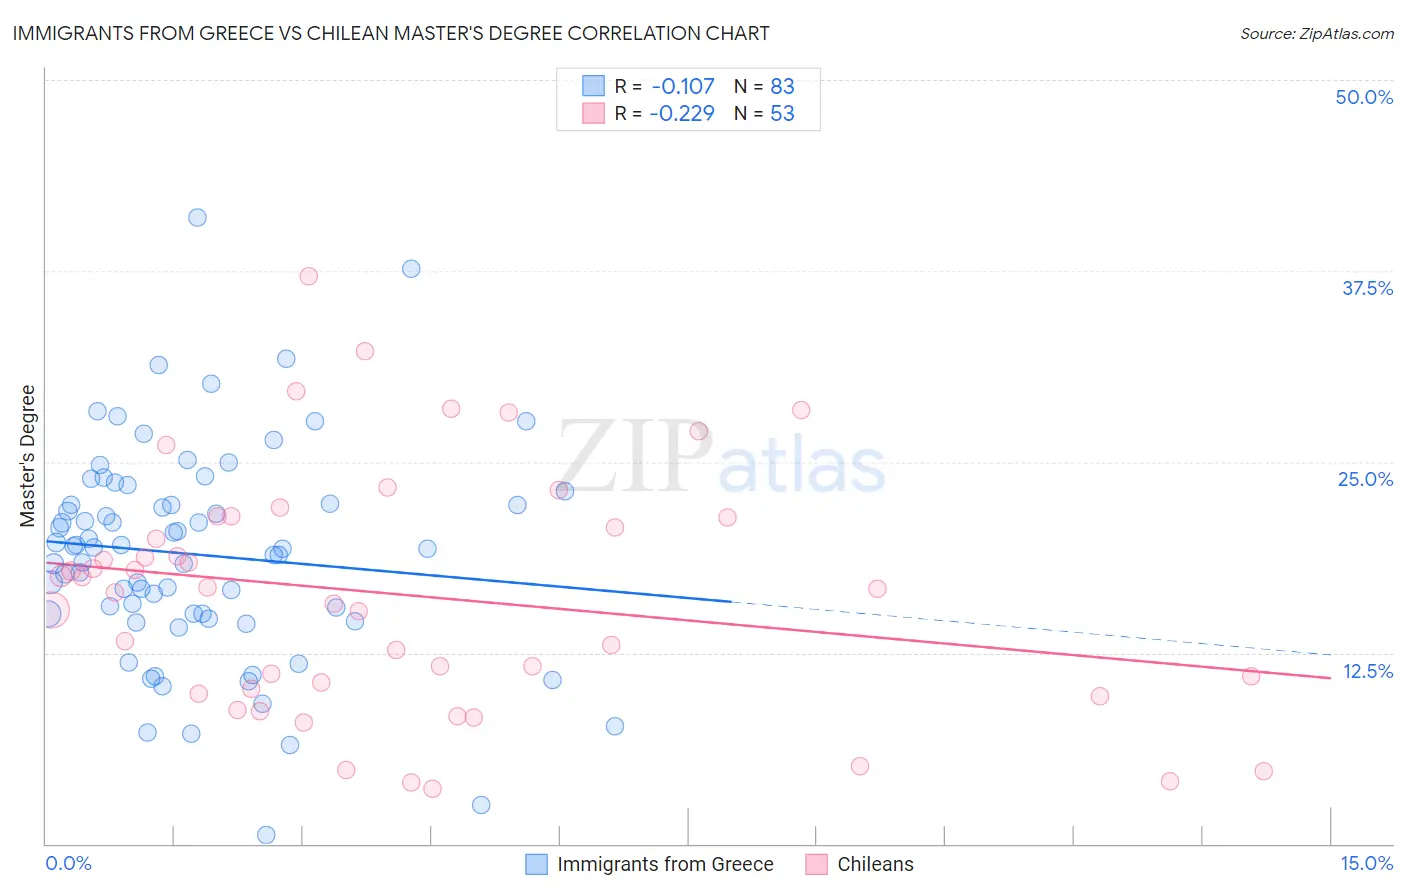
Immigrants from Greece vs Chilean Master's Degree Correlation Chart
The statistical analysis conducted on geographies consisting of 216,873,414 people shows a poor negative correlation between the proportion of Immigrants from Greece and percentage of population with at least master's degree education in the United States with a correlation coefficient (R) of -0.107 and weighted average of 19.0%. Similarly, the statistical analysis conducted on geographies consisting of 256,643,247 people shows a weak negative correlation between the proportion of Chileans and percentage of population with at least master's degree education in the United States with a correlation coefficient (R) of -0.229 and weighted average of 16.9%, a difference of 12.0%.
Master's Degree Correlation Summary
| Measurement | Immigrants from Greece | Chilean |
| Minimum | 0.57% | 3.6% |
| Maximum | 41.0% | 37.2% |
| Range | 40.4% | 33.5% |
| Mean | 18.9% | 16.3% |
| Median | 19.3% | 16.7% |
| Interquartile 25% (IQ1) | 15.1% | 10.0% |
| Interquartile 75% (IQ3) | 22.3% | 21.4% |
| Interquartile Range (IQR) | 7.2% | 11.4% |
| Standard Deviation (Sample) | 7.0% | 7.9% |
| Standard Deviation (Population) | 7.0% | 7.8% |
Similar Demographics by Master's Degree
Demographics Similar to Immigrants from Greece by Master's Degree
In terms of master's degree, the demographic groups most similar to Immigrants from Greece are Immigrants from Saudi Arabia (19.0%, a difference of 0.010%), Immigrants from Malaysia (18.9%, a difference of 0.28%), Immigrants from Belarus (18.9%, a difference of 0.39%), Immigrants from Latvia (19.1%, a difference of 0.44%), and Immigrants from Norway (18.8%, a difference of 0.78%).
| Demographics | Rating | Rank | Master's Degree |
| Immigrants | Russia | 100.0 /100 | #36 | Exceptional 19.4% |
| Mongolians | 100.0 /100 | #37 | Exceptional 19.4% |
| Bolivians | 100.0 /100 | #38 | Exceptional 19.3% |
| Immigrants | Spain | 100.0 /100 | #39 | Exceptional 19.1% |
| Immigrants | Bolivia | 100.0 /100 | #40 | Exceptional 19.1% |
| Immigrants | Latvia | 100.0 /100 | #41 | Exceptional 19.1% |
| Immigrants | Saudi Arabia | 100.0 /100 | #42 | Exceptional 19.0% |
| Immigrants | Greece | 100.0 /100 | #43 | Exceptional 19.0% |
| Immigrants | Malaysia | 100.0 /100 | #44 | Exceptional 18.9% |
| Immigrants | Belarus | 100.0 /100 | #45 | Exceptional 18.9% |
| Immigrants | Norway | 100.0 /100 | #46 | Exceptional 18.8% |
| Immigrants | Austria | 100.0 /100 | #47 | Exceptional 18.8% |
| Paraguayans | 100.0 /100 | #48 | Exceptional 18.8% |
| Estonians | 100.0 /100 | #49 | Exceptional 18.8% |
| Bulgarians | 100.0 /100 | #50 | Exceptional 18.8% |
Demographics Similar to Chileans by Master's Degree
In terms of master's degree, the demographic groups most similar to Chileans are Immigrants from Nepal (17.0%, a difference of 0.080%), Albanian (17.0%, a difference of 0.26%), Alsatian (16.9%, a difference of 0.33%), Ukrainian (16.9%, a difference of 0.45%), and Laotian (17.0%, a difference of 0.47%).
| Demographics | Rating | Rank | Master's Degree |
| Immigrants | Morocco | 98.9 /100 | #95 | Exceptional 17.1% |
| Immigrants | Northern Africa | 98.9 /100 | #96 | Exceptional 17.1% |
| Immigrants | England | 98.8 /100 | #97 | Exceptional 17.0% |
| Immigrants | Ukraine | 98.8 /100 | #98 | Exceptional 17.0% |
| Laotians | 98.8 /100 | #99 | Exceptional 17.0% |
| Albanians | 98.7 /100 | #100 | Exceptional 17.0% |
| Immigrants | Nepal | 98.6 /100 | #101 | Exceptional 17.0% |
| Chileans | 98.6 /100 | #102 | Exceptional 16.9% |
| Alsatians | 98.4 /100 | #103 | Exceptional 16.9% |
| Ukrainians | 98.3 /100 | #104 | Exceptional 16.9% |
| Syrians | 98.3 /100 | #105 | Exceptional 16.8% |
| Immigrants | Albania | 98.1 /100 | #106 | Exceptional 16.8% |
| Armenians | 98.0 /100 | #107 | Exceptional 16.8% |
| Sierra Leoneans | 98.0 /100 | #108 | Exceptional 16.8% |
| Moroccans | 98.0 /100 | #109 | Exceptional 16.8% |