Immigrants from Greece vs Central American Indian 8th Grade
COMPARE
Immigrants from Greece
Central American Indian
8th Grade
8th Grade Comparison
Immigrants from Greece
Central American Indians
96.0%
8TH GRADE
85.9/ 100
METRIC RATING
141st/ 347
METRIC RANK
92.7%
8TH GRADE
0.0/ 100
METRIC RATING
326th/ 347
METRIC RANK
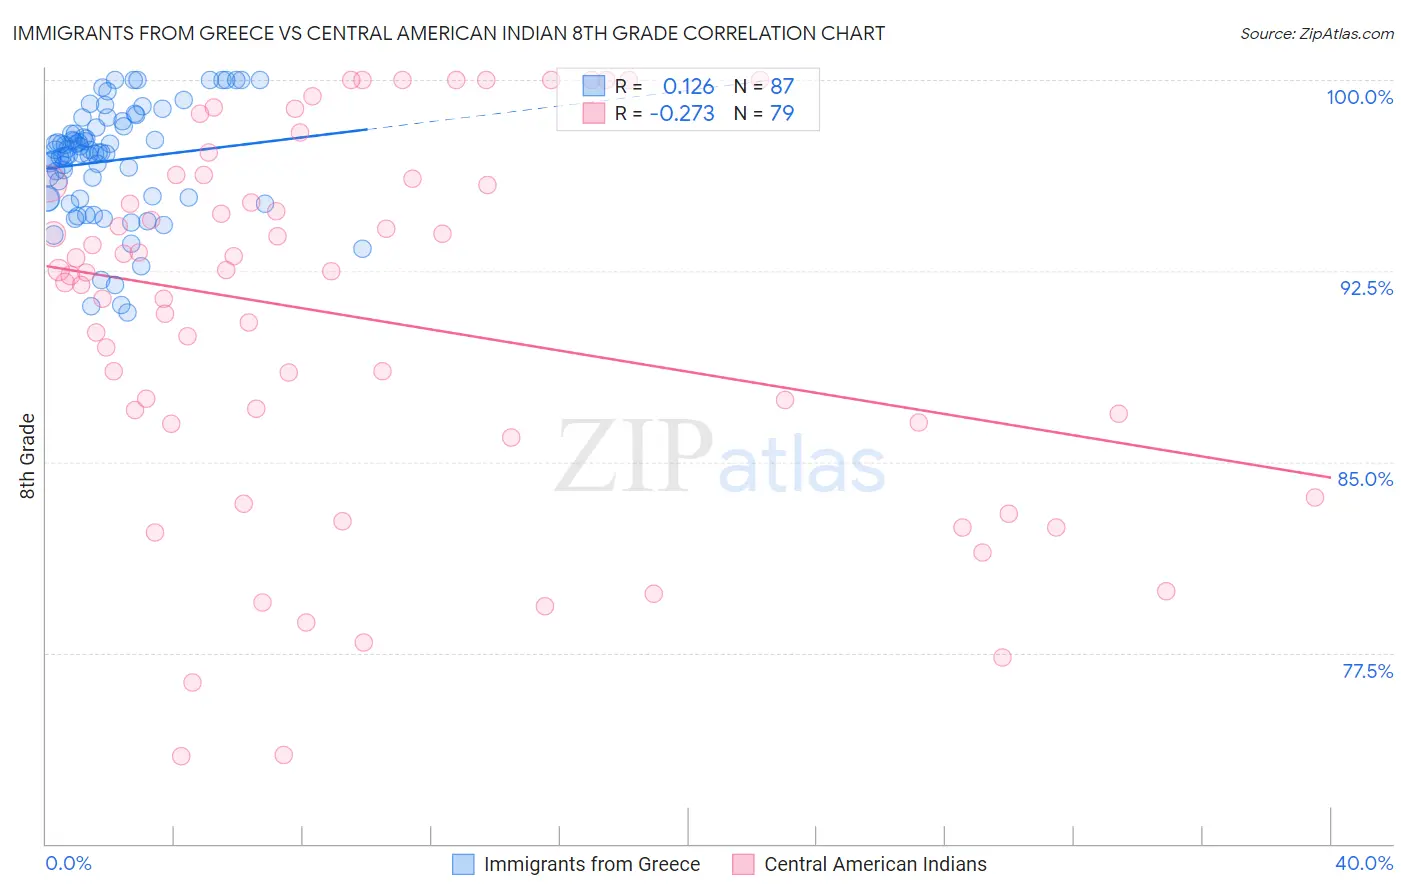
Immigrants from Greece vs Central American Indian 8th Grade Correlation Chart
The statistical analysis conducted on geographies consisting of 216,879,847 people shows a poor positive correlation between the proportion of Immigrants from Greece and percentage of population with at least 8th grade education in the United States with a correlation coefficient (R) of 0.126 and weighted average of 96.0%. Similarly, the statistical analysis conducted on geographies consisting of 326,142,643 people shows a weak negative correlation between the proportion of Central American Indians and percentage of population with at least 8th grade education in the United States with a correlation coefficient (R) of -0.273 and weighted average of 92.7%, a difference of 3.6%.
8th Grade Correlation Summary
| Measurement | Immigrants from Greece | Central American Indian |
| Minimum | 90.9% | 73.4% |
| Maximum | 100.0% | 100.0% |
| Range | 9.1% | 26.6% |
| Mean | 96.8% | 90.6% |
| Median | 97.2% | 92.4% |
| Interquartile 25% (IQ1) | 95.4% | 86.5% |
| Interquartile 75% (IQ3) | 98.2% | 95.9% |
| Interquartile Range (IQR) | 2.8% | 9.5% |
| Standard Deviation (Sample) | 2.2% | 7.2% |
| Standard Deviation (Population) | 2.2% | 7.1% |
Similar Demographics by 8th Grade
Demographics Similar to Immigrants from Greece by 8th Grade
In terms of 8th grade, the demographic groups most similar to Immigrants from Greece are Immigrants from Eastern Europe (96.0%, a difference of 0.010%), Spanish (96.0%, a difference of 0.010%), Immigrants from Belarus (96.0%, a difference of 0.010%), Lumbee (96.0%, a difference of 0.020%), and Israeli (96.0%, a difference of 0.020%).
| Demographics | Rating | Rank | 8th Grade |
| Immigrants | Hungary | 91.5 /100 | #134 | Exceptional 96.1% |
| Basques | 91.5 /100 | #135 | Exceptional 96.1% |
| Jordanians | 91.3 /100 | #136 | Exceptional 96.1% |
| Cambodians | 90.6 /100 | #137 | Exceptional 96.1% |
| Burmese | 90.2 /100 | #138 | Exceptional 96.1% |
| Hmong | 89.7 /100 | #139 | Excellent 96.1% |
| Immigrants | South Central Asia | 89.4 /100 | #140 | Excellent 96.1% |
| Immigrants | Greece | 85.9 /100 | #141 | Excellent 96.0% |
| Immigrants | Eastern Europe | 85.4 /100 | #142 | Excellent 96.0% |
| Spanish | 85.1 /100 | #143 | Excellent 96.0% |
| Immigrants | Belarus | 84.8 /100 | #144 | Excellent 96.0% |
| Lumbee | 84.1 /100 | #145 | Excellent 96.0% |
| Israelis | 84.1 /100 | #146 | Excellent 96.0% |
| Colville | 84.0 /100 | #147 | Excellent 96.0% |
| Albanians | 83.1 /100 | #148 | Excellent 96.0% |
Demographics Similar to Central American Indians by 8th Grade
In terms of 8th grade, the demographic groups most similar to Central American Indians are Dominican (92.8%, a difference of 0.050%), Nepalese (92.8%, a difference of 0.14%), Immigrants from Belize (92.9%, a difference of 0.21%), Immigrants from the Azores (92.5%, a difference of 0.25%), and Nicaraguan (93.0%, a difference of 0.26%).
| Demographics | Rating | Rank | 8th Grade |
| Immigrants | Cuba | 0.0 /100 | #319 | Tragic 93.2% |
| Immigrants | Fiji | 0.0 /100 | #320 | Tragic 93.2% |
| Belizeans | 0.0 /100 | #321 | Tragic 93.1% |
| Nicaraguans | 0.0 /100 | #322 | Tragic 93.0% |
| Immigrants | Belize | 0.0 /100 | #323 | Tragic 92.9% |
| Nepalese | 0.0 /100 | #324 | Tragic 92.8% |
| Dominicans | 0.0 /100 | #325 | Tragic 92.8% |
| Central American Indians | 0.0 /100 | #326 | Tragic 92.7% |
| Immigrants | Azores | 0.0 /100 | #327 | Tragic 92.5% |
| Immigrants | Nicaragua | 0.0 /100 | #328 | Tragic 92.5% |
| Immigrants | Cabo Verde | 0.0 /100 | #329 | Tragic 92.4% |
| Immigrants | Armenia | 0.0 /100 | #330 | Tragic 92.3% |
| Hondurans | 0.0 /100 | #331 | Tragic 92.3% |
| Immigrants | Dominican Republic | 0.0 /100 | #332 | Tragic 92.3% |
| Hispanics or Latinos | 0.0 /100 | #333 | Tragic 92.2% |