Immigrants from Greece vs Armenian 10th Grade
COMPARE
Immigrants from Greece
Armenian
10th Grade
10th Grade Comparison
Immigrants from Greece
Armenians
94.3%
10TH GRADE
92.7/ 100
METRIC RATING
130th/ 347
METRIC RANK
92.7%
10TH GRADE
0.9/ 100
METRIC RATING
254th/ 347
METRIC RANK
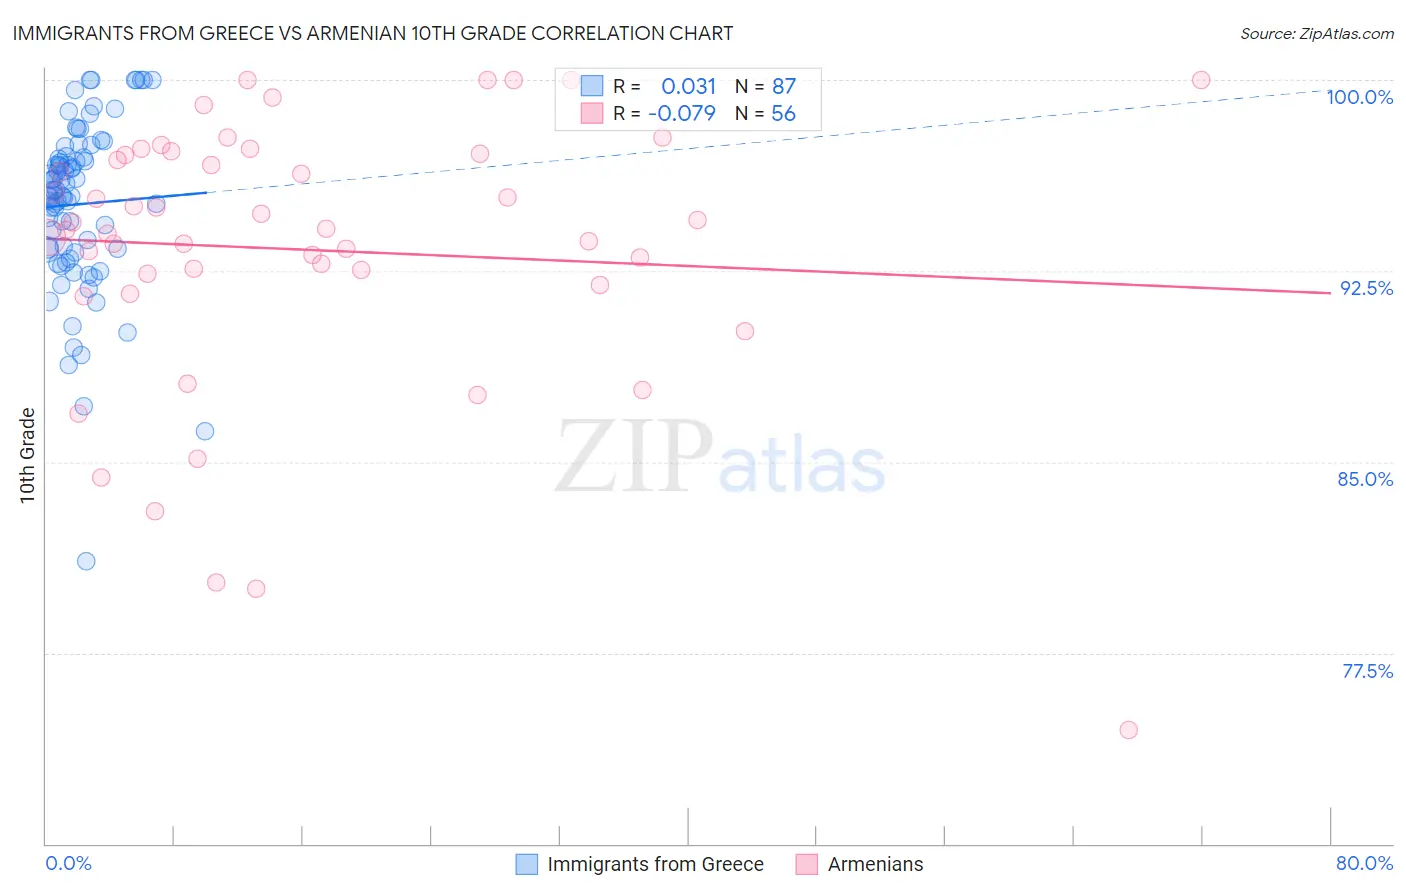
Immigrants from Greece vs Armenian 10th Grade Correlation Chart
The statistical analysis conducted on geographies consisting of 216,879,847 people shows no correlation between the proportion of Immigrants from Greece and percentage of population with at least 10th grade education in the United States with a correlation coefficient (R) of 0.031 and weighted average of 94.3%. Similarly, the statistical analysis conducted on geographies consisting of 310,954,685 people shows a slight negative correlation between the proportion of Armenians and percentage of population with at least 10th grade education in the United States with a correlation coefficient (R) of -0.079 and weighted average of 92.7%, a difference of 1.6%.
10th Grade Correlation Summary
| Measurement | Immigrants from Greece | Armenian |
| Minimum | 81.1% | 74.5% |
| Maximum | 100.0% | 100.0% |
| Range | 18.9% | 25.5% |
| Mean | 95.1% | 93.3% |
| Median | 95.6% | 94.1% |
| Interquartile 25% (IQ1) | 93.3% | 92.2% |
| Interquartile 75% (IQ3) | 97.0% | 97.1% |
| Interquartile Range (IQR) | 3.7% | 4.9% |
| Standard Deviation (Sample) | 3.3% | 5.4% |
| Standard Deviation (Population) | 3.3% | 5.3% |
Similar Demographics by 10th Grade
Demographics Similar to Immigrants from Greece by 10th Grade
In terms of 10th grade, the demographic groups most similar to Immigrants from Greece are Iroquois (94.3%, a difference of 0.0%), Immigrants from Eastern Europe (94.3%, a difference of 0.010%), Immigrants from Russia (94.3%, a difference of 0.010%), Potawatomi (94.3%, a difference of 0.030%), and Creek (94.2%, a difference of 0.030%).
| Demographics | Rating | Rank | 10th Grade |
| Cree | 95.1 /100 | #123 | Exceptional 94.4% |
| Basques | 94.9 /100 | #124 | Exceptional 94.3% |
| Americans | 94.4 /100 | #125 | Exceptional 94.3% |
| Immigrants | Iran | 94.4 /100 | #126 | Exceptional 94.3% |
| Israelis | 93.8 /100 | #127 | Exceptional 94.3% |
| Potawatomi | 93.6 /100 | #128 | Exceptional 94.3% |
| Iroquois | 92.8 /100 | #129 | Exceptional 94.3% |
| Immigrants | Greece | 92.7 /100 | #130 | Exceptional 94.3% |
| Immigrants | Eastern Europe | 92.5 /100 | #131 | Exceptional 94.3% |
| Immigrants | Russia | 92.4 /100 | #132 | Exceptional 94.3% |
| Creek | 91.9 /100 | #133 | Exceptional 94.2% |
| Osage | 91.7 /100 | #134 | Exceptional 94.2% |
| Immigrants | Korea | 91.3 /100 | #135 | Exceptional 94.2% |
| Shoshone | 90.8 /100 | #136 | Exceptional 94.2% |
| Arapaho | 90.5 /100 | #137 | Exceptional 94.2% |
Demographics Similar to Armenians by 10th Grade
In terms of 10th grade, the demographic groups most similar to Armenians are South American (92.8%, a difference of 0.010%), Ghanaian (92.8%, a difference of 0.010%), Immigrants from Thailand (92.8%, a difference of 0.020%), Immigrants from Bolivia (92.7%, a difference of 0.050%), and Immigrants from Nigeria (92.7%, a difference of 0.060%).
| Demographics | Rating | Rank | 10th Grade |
| Immigrants | Afghanistan | 1.4 /100 | #247 | Tragic 92.8% |
| Colombians | 1.4 /100 | #248 | Tragic 92.8% |
| Immigrants | Senegal | 1.4 /100 | #249 | Tragic 92.8% |
| Jamaicans | 1.2 /100 | #250 | Tragic 92.8% |
| Immigrants | Thailand | 1.0 /100 | #251 | Tragic 92.8% |
| South Americans | 0.9 /100 | #252 | Tragic 92.8% |
| Ghanaians | 0.9 /100 | #253 | Tragic 92.8% |
| Armenians | 0.9 /100 | #254 | Tragic 92.7% |
| Immigrants | Bolivia | 0.7 /100 | #255 | Tragic 92.7% |
| Immigrants | Nigeria | 0.7 /100 | #256 | Tragic 92.7% |
| U.S. Virgin Islanders | 0.7 /100 | #257 | Tragic 92.7% |
| Immigrants | Costa Rica | 0.6 /100 | #258 | Tragic 92.7% |
| Immigrants | Jamaica | 0.5 /100 | #259 | Tragic 92.6% |
| Immigrants | Uzbekistan | 0.5 /100 | #260 | Tragic 92.6% |
| Paiute | 0.4 /100 | #261 | Tragic 92.6% |