Immigrants from Greece vs Alaskan Athabascan 1st Grade
COMPARE
Immigrants from Greece
Alaskan Athabascan
1st Grade
1st Grade Comparison
Immigrants from Greece
Alaskan Athabascans
98.0%
1ST GRADE
74.9/ 100
METRIC RATING
149th/ 347
METRIC RANK
98.8%
1ST GRADE
100.0/ 100
METRIC RATING
6th/ 347
METRIC RANK
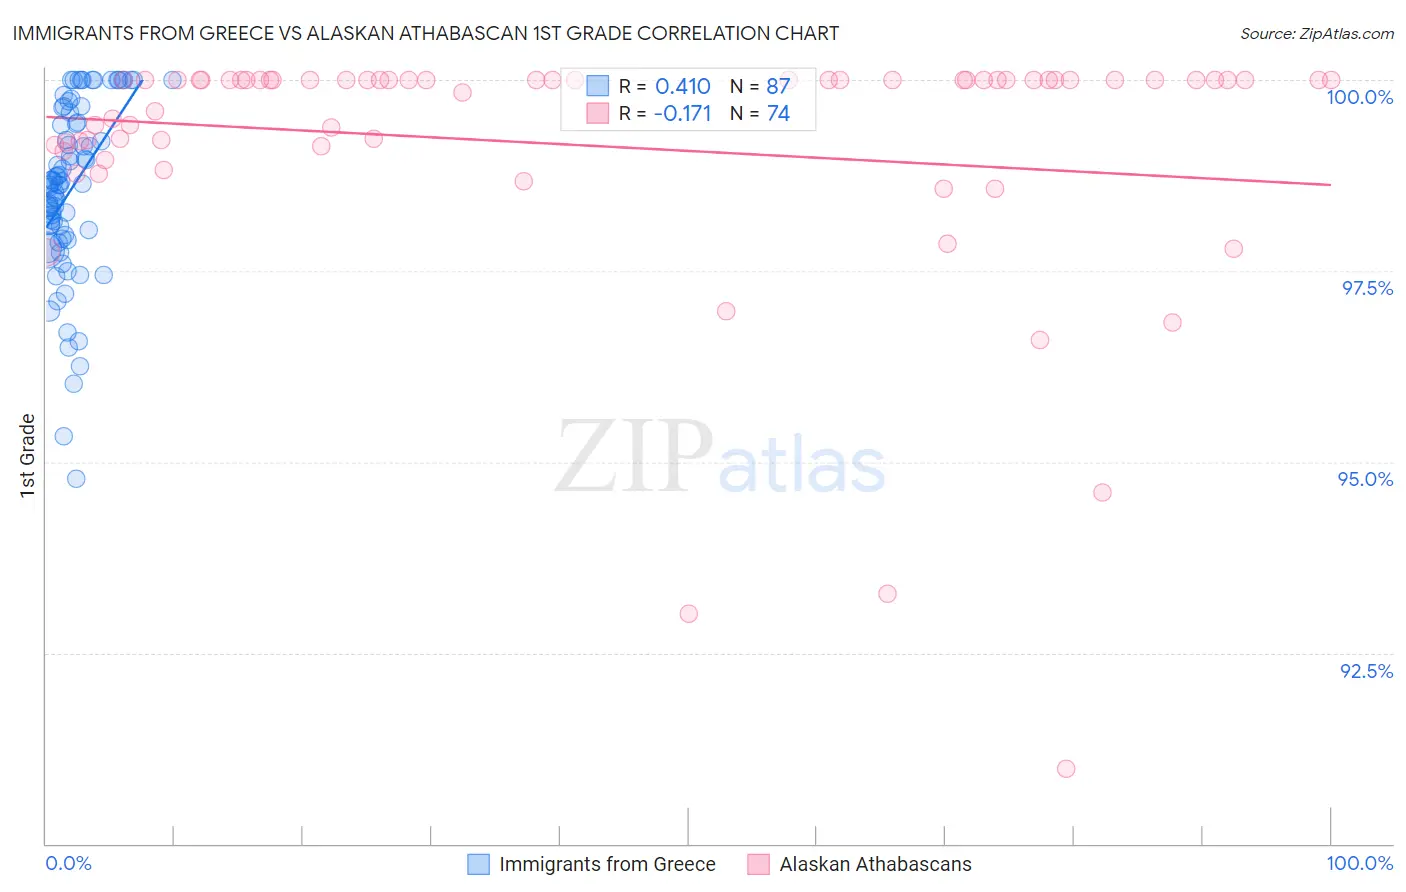
Immigrants from Greece vs Alaskan Athabascan 1st Grade Correlation Chart
The statistical analysis conducted on geographies consisting of 216,879,847 people shows a moderate positive correlation between the proportion of Immigrants from Greece and percentage of population with at least 1st grade education in the United States with a correlation coefficient (R) of 0.410 and weighted average of 98.0%. Similarly, the statistical analysis conducted on geographies consisting of 45,820,365 people shows a poor negative correlation between the proportion of Alaskan Athabascans and percentage of population with at least 1st grade education in the United States with a correlation coefficient (R) of -0.171 and weighted average of 98.8%, a difference of 0.78%.
1st Grade Correlation Summary
| Measurement | Immigrants from Greece | Alaskan Athabascan |
| Minimum | 94.8% | 91.0% |
| Maximum | 100.0% | 100.0% |
| Range | 5.2% | 9.0% |
| Mean | 98.6% | 99.1% |
| Median | 98.6% | 100.0% |
| Interquartile 25% (IQ1) | 98.0% | 99.1% |
| Interquartile 75% (IQ3) | 99.6% | 100.0% |
| Interquartile Range (IQR) | 1.6% | 0.87% |
| Standard Deviation (Sample) | 1.1% | 1.7% |
| Standard Deviation (Population) | 1.1% | 1.7% |
Similar Demographics by 1st Grade
Demographics Similar to Immigrants from Greece by 1st Grade
In terms of 1st grade, the demographic groups most similar to Immigrants from Greece are Apache (98.0%, a difference of 0.0%), Immigrants from Israel (98.0%, a difference of 0.010%), Filipino (98.0%, a difference of 0.010%), Jordanian (98.0%, a difference of 0.010%), and Hmong (98.0%, a difference of 0.020%).
| Demographics | Rating | Rank | 1st Grade |
| Marshallese | 82.0 /100 | #142 | Excellent 98.0% |
| Burmese | 81.0 /100 | #143 | Excellent 98.0% |
| Alsatians | 80.9 /100 | #144 | Excellent 98.0% |
| Hmong | 79.0 /100 | #145 | Good 98.0% |
| Immigrants | Israel | 77.8 /100 | #146 | Good 98.0% |
| Filipinos | 77.6 /100 | #147 | Good 98.0% |
| Apache | 75.2 /100 | #148 | Good 98.0% |
| Immigrants | Greece | 74.9 /100 | #149 | Good 98.0% |
| Jordanians | 72.7 /100 | #150 | Good 98.0% |
| Dutch West Indians | 69.8 /100 | #151 | Good 98.0% |
| Immigrants | Moldova | 69.5 /100 | #152 | Good 98.0% |
| Soviet Union | 68.9 /100 | #153 | Good 98.0% |
| Immigrants | Iran | 66.9 /100 | #154 | Good 98.0% |
| Comanche | 66.9 /100 | #155 | Good 98.0% |
| Immigrants | South Central Asia | 66.2 /100 | #156 | Good 98.0% |
Demographics Similar to Alaskan Athabascans by 1st Grade
In terms of 1st grade, the demographic groups most similar to Alaskan Athabascans are Alaska Native (98.7%, a difference of 0.050%), Tsimshian (98.8%, a difference of 0.060%), Norwegian (98.7%, a difference of 0.070%), Welsh (98.9%, a difference of 0.080%), and Slovak (98.7%, a difference of 0.090%).
| Demographics | Rating | Rank | 1st Grade |
| Crow | 100.0 /100 | #1 | Exceptional 99.6% |
| Yup'ik | 100.0 /100 | #2 | Exceptional 99.2% |
| Inupiat | 100.0 /100 | #3 | Exceptional 98.9% |
| Welsh | 100.0 /100 | #4 | Exceptional 98.9% |
| Tsimshian | 100.0 /100 | #5 | Exceptional 98.8% |
| Alaskan Athabascans | 100.0 /100 | #6 | Exceptional 98.8% |
| Alaska Natives | 100.0 /100 | #7 | Exceptional 98.7% |
| Norwegians | 100.0 /100 | #8 | Exceptional 98.7% |
| Slovaks | 100.0 /100 | #9 | Exceptional 98.7% |
| Germans | 100.0 /100 | #10 | Exceptional 98.7% |
| Tlingit-Haida | 100.0 /100 | #11 | Exceptional 98.7% |
| Slovenes | 100.0 /100 | #12 | Exceptional 98.7% |
| Carpatho Rusyns | 100.0 /100 | #13 | Exceptional 98.6% |
| English | 100.0 /100 | #14 | Exceptional 98.6% |
| Swedes | 100.0 /100 | #15 | Exceptional 98.6% |