Immigrants from Germany vs Immigrants from El Salvador 5th Grade
COMPARE
Immigrants from Germany
Immigrants from El Salvador
5th Grade
5th Grade Comparison
Immigrants from Germany
Immigrants from El Salvador
97.8%
5TH GRADE
98.5/ 100
METRIC RATING
96th/ 347
METRIC RANK
94.3%
5TH GRADE
0.0/ 100
METRIC RATING
346th/ 347
METRIC RANK
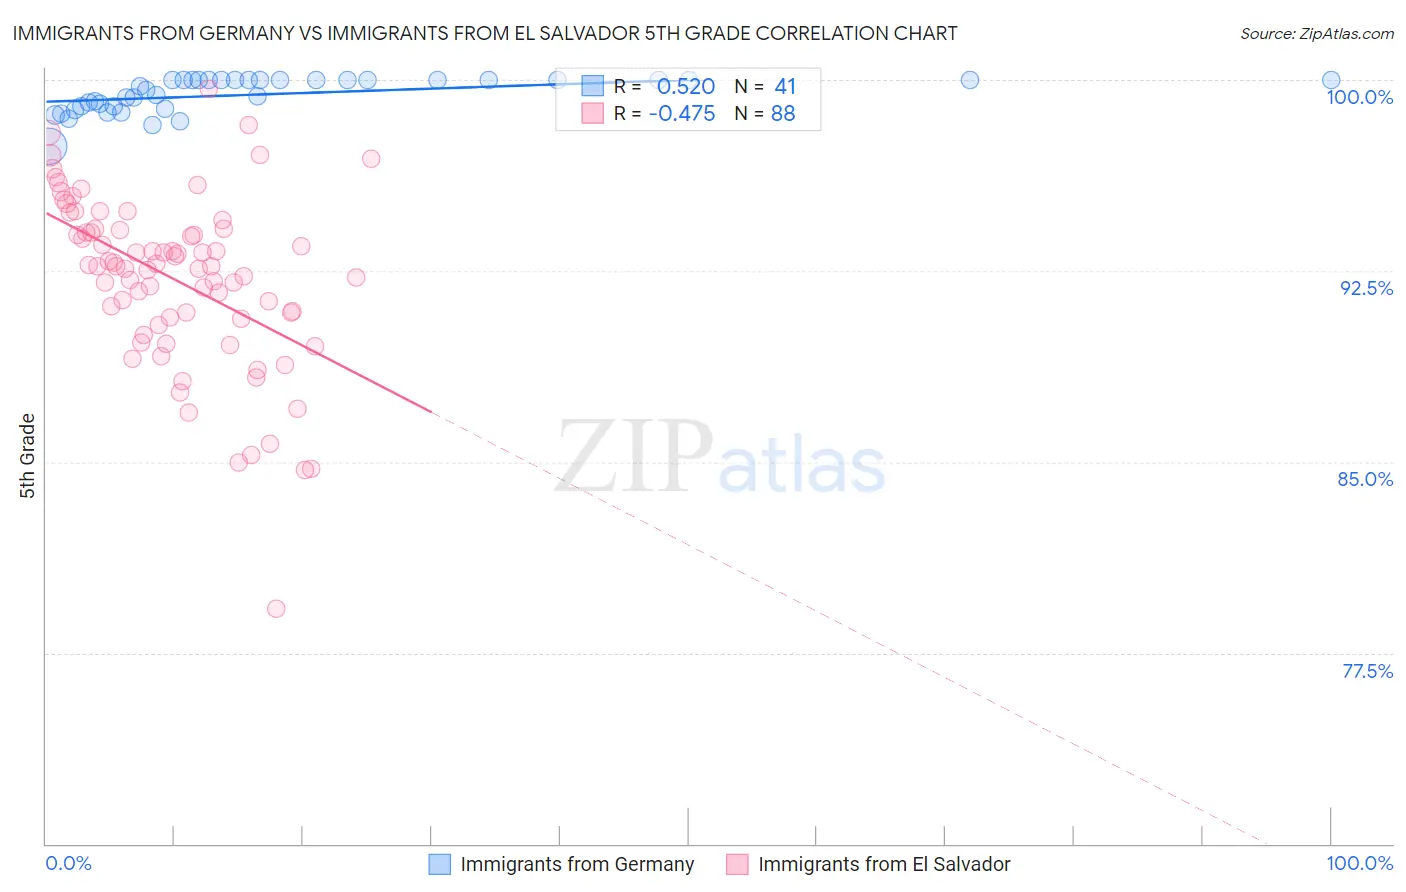
Immigrants from Germany vs Immigrants from El Salvador 5th Grade Correlation Chart
The statistical analysis conducted on geographies consisting of 463,886,643 people shows a substantial positive correlation between the proportion of Immigrants from Germany and percentage of population with at least 5th grade education in the United States with a correlation coefficient (R) of 0.520 and weighted average of 97.8%. Similarly, the statistical analysis conducted on geographies consisting of 357,823,835 people shows a moderate negative correlation between the proportion of Immigrants from El Salvador and percentage of population with at least 5th grade education in the United States with a correlation coefficient (R) of -0.475 and weighted average of 94.3%, a difference of 3.6%.
5th Grade Correlation Summary
| Measurement | Immigrants from Germany | Immigrants from El Salvador |
| Minimum | 97.4% | 79.2% |
| Maximum | 100.0% | 99.7% |
| Range | 2.6% | 20.4% |
| Mean | 99.4% | 92.2% |
| Median | 99.8% | 92.7% |
| Interquartile 25% (IQ1) | 98.9% | 90.7% |
| Interquartile 75% (IQ3) | 100.0% | 94.1% |
| Interquartile Range (IQR) | 1.1% | 3.5% |
| Standard Deviation (Sample) | 0.67% | 3.4% |
| Standard Deviation (Population) | 0.66% | 3.4% |
Similar Demographics by 5th Grade
Demographics Similar to Immigrants from Germany by 5th Grade
In terms of 5th grade, the demographic groups most similar to Immigrants from Germany are Immigrants from Denmark (97.8%, a difference of 0.0%), Romanian (97.8%, a difference of 0.0%), Immigrants from Sweden (97.8%, a difference of 0.010%), Delaware (97.8%, a difference of 0.010%), and Cree (97.7%, a difference of 0.010%).
| Demographics | Rating | Rank | 5th Grade |
| Immigrants | South Africa | 98.8 /100 | #89 | Exceptional 97.8% |
| Immigrants | Ireland | 98.8 /100 | #90 | Exceptional 97.8% |
| Immigrants | Western Europe | 98.8 /100 | #91 | Exceptional 97.8% |
| Immigrants | Sweden | 98.7 /100 | #92 | Exceptional 97.8% |
| Delaware | 98.6 /100 | #93 | Exceptional 97.8% |
| Immigrants | Denmark | 98.6 /100 | #94 | Exceptional 97.8% |
| Romanians | 98.6 /100 | #95 | Exceptional 97.8% |
| Immigrants | Germany | 98.5 /100 | #96 | Exceptional 97.8% |
| Cree | 98.4 /100 | #97 | Exceptional 97.7% |
| Yugoslavians | 98.3 /100 | #98 | Exceptional 97.7% |
| Turks | 98.3 /100 | #99 | Exceptional 97.7% |
| Puget Sound Salish | 98.3 /100 | #100 | Exceptional 97.7% |
| South Africans | 98.3 /100 | #101 | Exceptional 97.7% |
| Choctaw | 98.0 /100 | #102 | Exceptional 97.7% |
| Cheyenne | 97.9 /100 | #103 | Exceptional 97.7% |
Demographics Similar to Immigrants from El Salvador by 5th Grade
In terms of 5th grade, the demographic groups most similar to Immigrants from El Salvador are Spanish American Indian (94.2%, a difference of 0.11%), Immigrants from Guatemala (94.6%, a difference of 0.28%), Salvadoran (94.6%, a difference of 0.29%), Immigrants from Mexico (94.6%, a difference of 0.29%), and Immigrants from Central America (94.7%, a difference of 0.34%).
| Demographics | Rating | Rank | 5th Grade |
| Immigrants | Latin America | 0.0 /100 | #333 | Tragic 95.3% |
| Nepalese | 0.0 /100 | #334 | Tragic 95.2% |
| Mexicans | 0.0 /100 | #335 | Tragic 95.2% |
| Immigrants | Azores | 0.0 /100 | #336 | Tragic 95.1% |
| Central Americans | 0.0 /100 | #337 | Tragic 95.1% |
| Immigrants | Cabo Verde | 0.0 /100 | #338 | Tragic 94.9% |
| Immigrants | Yemen | 0.0 /100 | #339 | Tragic 94.9% |
| Guatemalans | 0.0 /100 | #340 | Tragic 94.8% |
| Yakama | 0.0 /100 | #341 | Tragic 94.8% |
| Immigrants | Central America | 0.0 /100 | #342 | Tragic 94.7% |
| Salvadorans | 0.0 /100 | #343 | Tragic 94.6% |
| Immigrants | Mexico | 0.0 /100 | #344 | Tragic 94.6% |
| Immigrants | Guatemala | 0.0 /100 | #345 | Tragic 94.6% |
| Immigrants | El Salvador | 0.0 /100 | #346 | Tragic 94.3% |
| Spanish American Indians | 0.0 /100 | #347 | Tragic 94.2% |