Immigrants from France vs Immigrants from Iran College, Under 1 year

COMPARE

Immigrants from France
Race
Ancestry
AfghanAfricanAlaska NativeAlaskan AthabascanAlbanianAleutAlsatianAmericanApacheArabArapahoArgentineanArmenianAssyrian/Chaldean/SyriacAustralianAustrianBahamianBangladeshiBarbadianBasqueBelgianBelizeanBermudanBhutaneseBlackfeetBolivianBrazilianBritishBritish West IndianBulgarianBurmeseCajunCambodianCanadianCape VerdeanCarpatho RusynCelticCentral AmericanCentral American IndianCherokeeCheyenneChickasawChileanChineseChippewaChoctawColombianColvilleComancheCosta RicanCreeCreekCroatianCrowCubanCypriotCzechCzechoslovakianDanishDelawareDominicanDutchDutch West IndianEastern EuropeanEcuadorianEgyptianEnglishEstonianEthiopianEuropeanFijianFilipinoFinnishFrenchFrench American IndianFrench CanadianGermanGerman RussianGhanaianGreekGuamanian/ChamorroGuatemalanGuyaneseHaitianHmongHonduranHopiHoumaHungarianIcelanderIndian (Asian)IndonesianInupiatIranianIraqiIrishIroquoisIsraeliItalianJamaicanJapaneseJordanianKenyanKiowaKoreanLaotianLatvianLebaneseLiberianLithuanianLumbeeLuxembourgerMacedonianMalaysianMalteseMarshalleseMenomineeMexicanMexican American IndianMongolianMoroccanNative HawaiianNavajoNepaleseNew ZealanderNicaraguanNigerianNorthern EuropeanNorwegianOkinawanOsageOttawaPaiutePakistaniPalestinianPanamanianParaguayanPennsylvania GermanPeruvianPimaPolishPortuguesePotawatomiPuebloPuerto RicanPuget Sound SalishRomanianRussianSalvadoranSamoanScandinavianScotch-IrishScottishSeminoleSenegaleseSerbianShoshoneSierra LeoneanSiouxSlavicSlovakSloveneSomaliSouth AfricanSouth AmericanSouth American IndianSoviet UnionSpaniardSpanishSpanish AmericanSpanish American IndianSri LankanSubsaharan AfricanSudaneseSwedishSwissSyrianTaiwaneseThaiTlingit-HaidaTohono O'OdhamTonganTrinidadian and TobagonianTsimshianTurkishU.S. Virgin IslanderUgandanUkrainianUruguayanUteVenezuelanVietnameseWelshWest IndianYakamaYaquiYugoslavianYumanYup'ikZimbabwean
Immigration
NonimmigrantsImmigrantsAfghanistanAfricaAlbaniaArgentinaArmeniaAsiaAustraliaAustriaBahamasBangladeshBarbadosBelarusBelgiumBelizeBoliviaBosnia and HerzegovinaBrazilBulgariaBurma/MyanmarCabo VerdeCambodiaCameroonCanadaCaribbeanCentral AmericaChileChinaColombiaCongoCosta RicaCroatiaCubaCzechoslovakiaDenmarkDominicaDominican RepublicEastern AfricaEastern AsiaEastern EuropeEcuadorEgyptEl SalvadorEnglandEritreaEthiopiaEuropeFijiFranceGermanyGhanaGreeceGrenadaGuatemalaGuyanaHaitiHondurasHong KongHungaryIndiaIndonesiaIraqIrelandIsraelItalyJamaicaJapanJordanKazakhstanKenyaKoreaKuwaitLaosLatin AmericaLatviaLebanonLiberiaLithuaniaMalaysiaMexicoMicronesiaMiddle AfricaMoldovaMoroccoNepalNetherlandsNicaraguaNigeriaNorth AmericaNorth MacedoniaNorthern AfricaNorthern EuropeNorwayOceaniaPakistanPanamaPeruPhilippinesPolandPortugalRomaniaRussiaSaudi ArabiaScotlandSenegalSerbiaSierra LeoneSingaporeSomaliaSouth AfricaSouth AmericaSouth Central AsiaSouth Eastern AsiaSouthern EuropeSpainSri LankaSt. Vincent and the GrenadinesSudanSwedenSwitzerlandSyriaTaiwanThailandTrinidad and TobagoTurkeyUgandaUkraineUruguayUzbekistanVenezuelaVietnamWest IndiesWestern AfricaWestern AsiaWestern EuropeYemenZaireZimbabweAzores
Immigrants from Iran
Race
Ancestry
AfghanAfricanAlaska NativeAlaskan AthabascanAlbanianAleutAlsatianAmericanApacheArabArapahoArgentineanArmenianAssyrian/Chaldean/SyriacAustralianAustrianBahamianBangladeshiBarbadianBasqueBelgianBelizeanBermudanBhutaneseBlackfeetBolivianBrazilianBritishBritish West IndianBulgarianBurmeseCajunCambodianCanadianCape VerdeanCarpatho RusynCelticCentral AmericanCentral American IndianCherokeeCheyenneChickasawChileanChineseChippewaChoctawColombianColvilleComancheCosta RicanCreeCreekCroatianCrowCubanCypriotCzechCzechoslovakianDanishDelawareDominicanDutchDutch West IndianEastern EuropeanEcuadorianEgyptianEnglishEstonianEthiopianEuropeanFijianFilipinoFinnishFrenchFrench American IndianFrench CanadianGermanGerman RussianGhanaianGreekGuamanian/ChamorroGuatemalanGuyaneseHaitianHmongHonduranHopiHoumaHungarianIcelanderIndian (Asian)IndonesianInupiatIranianIraqiIrishIroquoisIsraeliItalianJamaicanJapaneseJordanianKenyanKiowaKoreanLaotianLatvianLebaneseLiberianLithuanianLumbeeLuxembourgerMacedonianMalaysianMalteseMarshalleseMenomineeMexicanMexican American IndianMongolianMoroccanNative HawaiianNavajoNepaleseNew ZealanderNicaraguanNigerianNorthern EuropeanNorwegianOkinawanOsageOttawaPaiutePakistaniPalestinianPanamanianParaguayanPennsylvania GermanPeruvianPimaPolishPortuguesePotawatomiPuebloPuerto RicanPuget Sound SalishRomanianRussianSalvadoranSamoanScandinavianScotch-IrishScottishSeminoleSenegaleseSerbianShoshoneSierra LeoneanSiouxSlavicSlovakSloveneSomaliSouth AfricanSouth AmericanSouth American IndianSoviet UnionSpaniardSpanishSpanish AmericanSpanish American IndianSri LankanSubsaharan AfricanSudaneseSwedishSwissSyrianTaiwaneseThaiTlingit-HaidaTohono O'OdhamTonganTrinidadian and TobagonianTsimshianTurkishU.S. Virgin IslanderUgandanUkrainianUruguayanUteVenezuelanVietnameseWelshWest IndianYakamaYaquiYugoslavianYumanYup'ikZimbabwean
Immigration
NonimmigrantsImmigrantsAfghanistanAfricaAlbaniaArgentinaArmeniaAsiaAustraliaAustriaBahamasBangladeshBarbadosBelarusBelgiumBelizeBoliviaBosnia and HerzegovinaBrazilBulgariaBurma/MyanmarCabo VerdeCambodiaCameroonCanadaCaribbeanCentral AmericaChileChinaColombiaCongoCosta RicaCroatiaCubaCzechoslovakiaDenmarkDominicaDominican RepublicEastern AfricaEastern AsiaEastern EuropeEcuadorEgyptEl SalvadorEnglandEritreaEthiopiaEuropeFijiGermanyGhanaGreeceGrenadaGuatemalaGuyanaHaitiHondurasHong KongHungaryIndiaIndonesiaIranIraqIrelandIsraelItalyJamaicaJapanJordanKazakhstanKenyaKoreaKuwaitLaosLatin AmericaLatviaLebanonLiberiaLithuaniaMalaysiaMexicoMicronesiaMiddle AfricaMoldovaMoroccoNepalNetherlandsNicaraguaNigeriaNorth AmericaNorth MacedoniaNorthern AfricaNorthern EuropeNorwayOceaniaPakistanPanamaPeruPhilippinesPolandPortugalRomaniaRussiaSaudi ArabiaScotlandSenegalSerbiaSierra LeoneSingaporeSomaliaSouth AfricaSouth AmericaSouth Central AsiaSouth Eastern AsiaSouthern EuropeSpainSri LankaSt. Vincent and the GrenadinesSudanSwedenSwitzerlandSyriaTaiwanThailandTrinidad and TobagoTurkeyUgandaUkraineUruguayUzbekistanVenezuelaVietnamWest IndiesWestern AfricaWestern AsiaWestern EuropeYemenZaireZimbabweAzores
College, Under 1 year
Income
Poverty
Unemployment
Labor Participation
Family Structure
Vehicle Availability
Education Level
Disability

College, Under 1 year Comparison

Immigrants from France

Immigrants from Iran

Exceptional
Exceptional
71.0%
COLLEGE, UNDER 1 YEAR
100.0/ 100
METRIC RATING
29th/ 347
METRIC RANK
74.3%
COLLEGE, UNDER 1 YEAR
100.0/ 100
METRIC RATING
5th/ 347
METRIC RANK

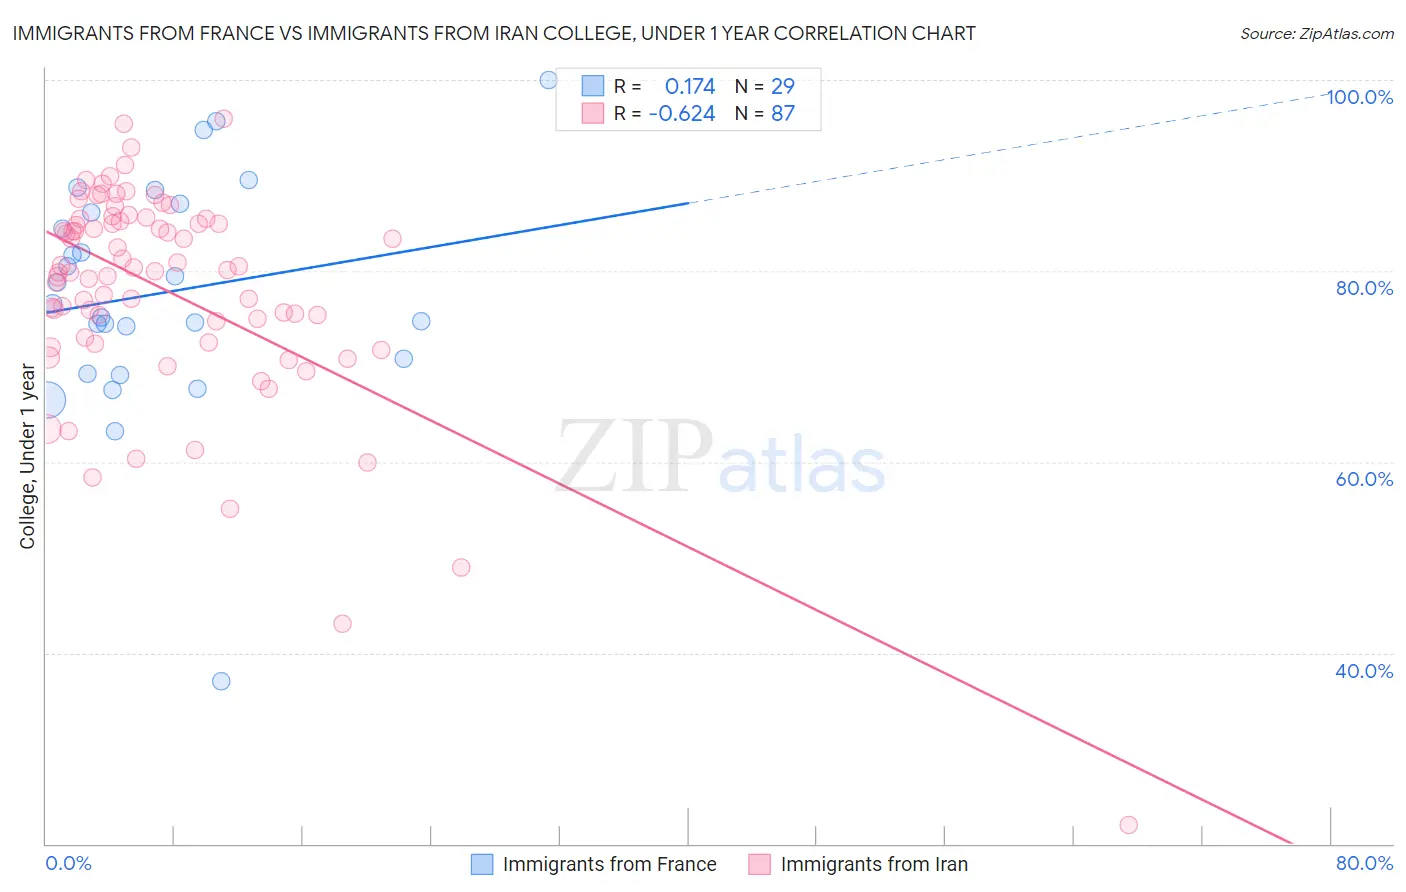
Immigrants from France vs Immigrants from Iran College, Under 1 year Correlation Chart

The statistical analysis conducted on geographies consisting of 287,918,760 people shows a poor positive correlation between the proportion of Immigrants from France and percentage of population with at least college, under 1 year education in the United States with a correlation coefficient (R) of 0.174 and weighted average of 71.0%. Similarly, the statistical analysis conducted on geographies consisting of 279,905,207 people shows a significant negative correlation between the proportion of Immigrants from Iran and percentage of population with at least college, under 1 year education in the United States with a correlation coefficient (R) of -0.624 and weighted average of 74.3%, a difference of 4.6%.
Immigrants from France vs Immigrants from Iran College, Under 1 year

College, Under 1 year Correlation Summary

MeasurementImmigrants from FranceImmigrants from Iran
Minimum37.0%22.0%
Maximum100.0%96.0%
Range63.0%74.0%
Mean77.7%78.0%
Median76.6%80.1%
Interquartile 25% (IQ1)70.0%73.1%
Interquartile 75% (IQ3)86.6%85.5%
Interquartile Range (IQR)16.6%12.4%
Standard Deviation (Sample)12.2%11.6%
Standard Deviation (Population)12.0%11.5%

Similar Demographics by College, Under 1 year

Demographics Similar to Immigrants from France by College, Under 1 year

In terms of college, under 1 year, the demographic groups most similar to Immigrants from France are Immigrants from Hong Kong (71.0%, a difference of 0.0%), Immigrants from Ireland (71.0%, a difference of 0.030%), Immigrants from Denmark (71.0%, a difference of 0.040%), Bulgarian (71.1%, a difference of 0.15%), and Soviet Union (71.1%, a difference of 0.17%).
DemographicsRating | RankCollege, Under 1 year
Immigrants | Eastern Asia
100.0
/100
|
#22
Exceptional
71.3%
Immigrants | Northern Europe
100.0
/100
|
#23
Exceptional
71.1%
Soviet Union
100.0
/100
|
#24
Exceptional
71.1%
Bulgarians
100.0
/100
|
#25
Exceptional
71.1%
Immigrants | Denmark
100.0
/100
|
#26
Exceptional
71.0%
Immigrants | Ireland
100.0
/100
|
#27
Exceptional
71.0%
Immigrants | Hong Kong
100.0
/100
|
#28
Exceptional
71.0%
Immigrants | France
100.0
/100
|
#29
Exceptional
71.0%
Immigrants | China
99.9
/100
|
#30
Exceptional
70.9%
Indians (Asian)
99.9
/100
|
#31
Exceptional
70.8%
Turks
99.9
/100
|
#32
Exceptional
70.7%
Immigrants | South Africa
99.9
/100
|
#33
Exceptional
70.6%
Estonians
99.9
/100
|
#34
Exceptional
70.6%
Russians
99.9
/100
|
#35
Exceptional
70.5%
Immigrants | Sri Lanka
99.9
/100
|
#36
Exceptional
70.5%

Demographics Similar to Immigrants from Iran by College, Under 1 year

In terms of college, under 1 year, the demographic groups most similar to Immigrants from Iran are Immigrants from Taiwan (74.2%, a difference of 0.11%), Immigrants from India (74.4%, a difference of 0.23%), Immigrants from Singapore (74.8%, a difference of 0.74%), Iranian (74.9%, a difference of 0.79%), and Okinawan (73.7%, a difference of 0.80%).
DemographicsRating | RankCollege, Under 1 year
Filipinos
100.0
/100
|
#1
Exceptional
75.5%
Iranians
100.0
/100
|
#2
Exceptional
74.9%
Immigrants | Singapore
100.0
/100
|
#3
Exceptional
74.8%
Immigrants | India
100.0
/100
|
#4
Exceptional
74.4%
Immigrants | Iran
100.0
/100
|
#5
Exceptional
74.3%
Immigrants | Taiwan
100.0
/100
|
#6
Exceptional
74.2%
Okinawans
100.0
/100
|
#7
Exceptional
73.7%
Thais
100.0
/100
|
#8
Exceptional
73.4%
Immigrants | Australia
100.0
/100
|
#9
Exceptional
72.7%
Immigrants | Israel
100.0
/100
|
#10
Exceptional
72.3%
Immigrants | South Central Asia
100.0
/100
|
#11
Exceptional
72.1%
Immigrants | Sweden
100.0
/100
|
#12
Exceptional
72.1%
Cypriots
100.0
/100
|
#13
Exceptional
72.0%
Cambodians
100.0
/100
|
#14
Exceptional
71.9%
Burmese
100.0
/100
|
#15
Exceptional
71.9%