Immigrants from Fiji vs Alaskan Athabascan Bachelor's Degree
COMPARE
Immigrants from Fiji
Alaskan Athabascan
Bachelor's Degree
Bachelor's Degree Comparison
Immigrants from Fiji
Alaskan Athabascans
33.7%
BACHELOR'S DEGREE
1.2/ 100
METRIC RATING
245th/ 347
METRIC RANK
28.8%
BACHELOR'S DEGREE
0.0/ 100
METRIC RATING
321st/ 347
METRIC RANK
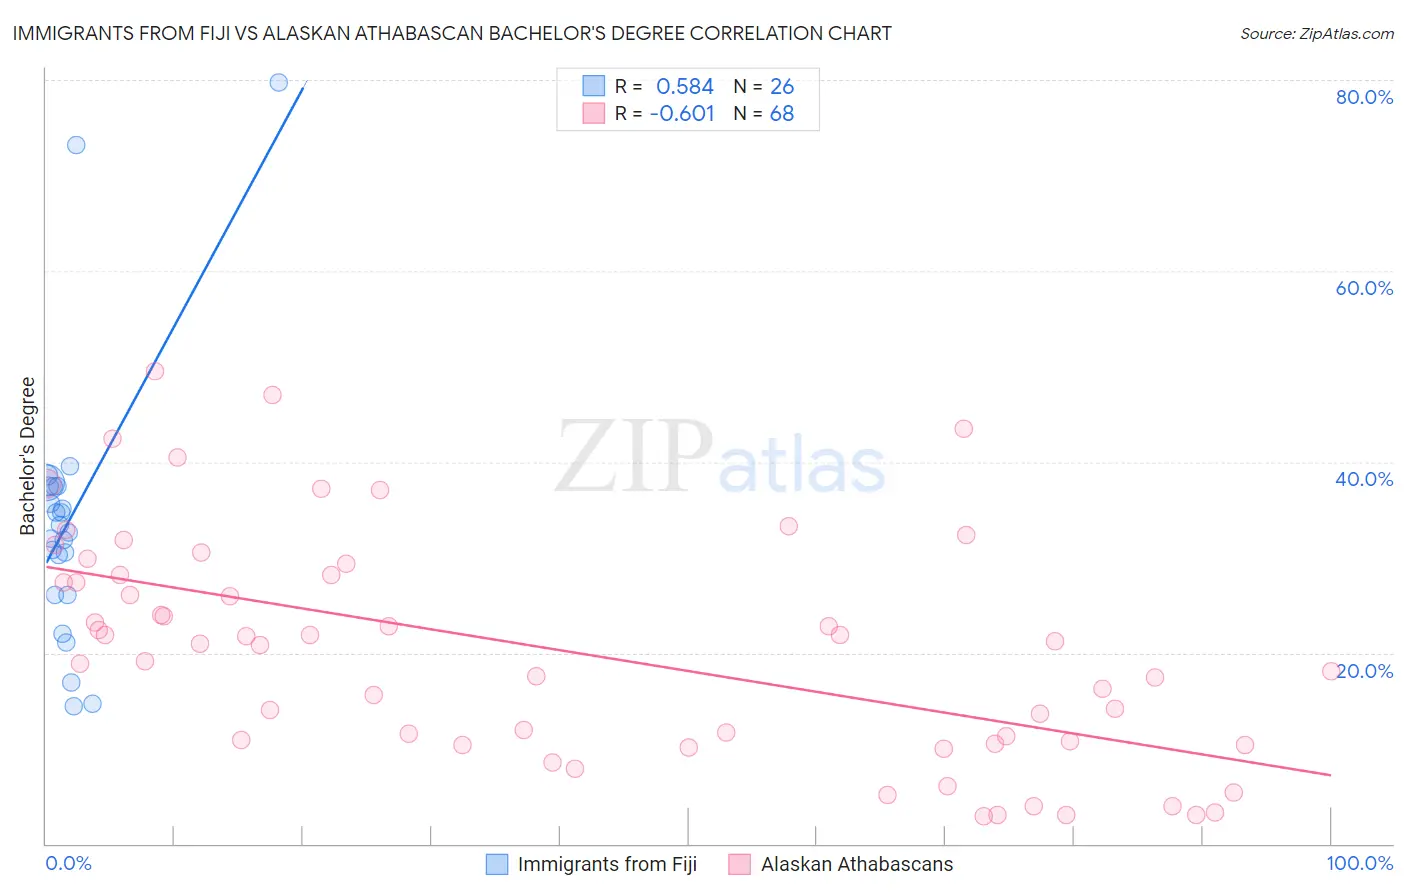
Immigrants from Fiji vs Alaskan Athabascan Bachelor's Degree Correlation Chart
The statistical analysis conducted on geographies consisting of 93,755,724 people shows a substantial positive correlation between the proportion of Immigrants from Fiji and percentage of population with at least bachelor's degree education in the United States with a correlation coefficient (R) of 0.584 and weighted average of 33.7%. Similarly, the statistical analysis conducted on geographies consisting of 45,819,303 people shows a significant negative correlation between the proportion of Alaskan Athabascans and percentage of population with at least bachelor's degree education in the United States with a correlation coefficient (R) of -0.601 and weighted average of 28.8%, a difference of 17.1%.
Bachelor's Degree Correlation Summary
| Measurement | Immigrants from Fiji | Alaskan Athabascan |
| Minimum | 14.4% | 2.9% |
| Maximum | 79.8% | 49.4% |
| Range | 65.4% | 46.5% |
| Mean | 34.0% | 20.3% |
| Median | 33.0% | 20.9% |
| Interquartile 25% (IQ1) | 26.1% | 10.6% |
| Interquartile 75% (IQ3) | 37.5% | 28.2% |
| Interquartile Range (IQR) | 11.4% | 17.6% |
| Standard Deviation (Sample) | 14.5% | 11.8% |
| Standard Deviation (Population) | 14.3% | 11.7% |
Similar Demographics by Bachelor's Degree
Demographics Similar to Immigrants from Fiji by Bachelor's Degree
In terms of bachelor's degree, the demographic groups most similar to Immigrants from Fiji are Delaware (33.8%, a difference of 0.090%), Jamaican (33.6%, a difference of 0.36%), Immigrants from Congo (33.6%, a difference of 0.45%), Cree (33.6%, a difference of 0.47%), and Immigrants from Guyana (33.9%, a difference of 0.59%).
| Demographics | Rating | Rank | Bachelor's Degree |
| Guyanese | 2.5 /100 | #238 | Tragic 34.5% |
| British West Indians | 2.5 /100 | #239 | Tragic 34.5% |
| Tongans | 2.0 /100 | #240 | Tragic 34.3% |
| Immigrants | Cambodia | 1.9 /100 | #241 | Tragic 34.2% |
| Immigrants | Nonimmigrants | 1.8 /100 | #242 | Tragic 34.2% |
| Immigrants | Guyana | 1.4 /100 | #243 | Tragic 33.9% |
| Delaware | 1.2 /100 | #244 | Tragic 33.8% |
| Immigrants | Fiji | 1.2 /100 | #245 | Tragic 33.7% |
| Jamaicans | 1.0 /100 | #246 | Tragic 33.6% |
| Immigrants | Congo | 1.0 /100 | #247 | Tragic 33.6% |
| Cree | 1.0 /100 | #248 | Tragic 33.6% |
| Immigrants | Liberia | 0.9 /100 | #249 | Tragic 33.5% |
| Indonesians | 0.9 /100 | #250 | Tragic 33.5% |
| Japanese | 0.7 /100 | #251 | Tragic 33.3% |
| Immigrants | Bahamas | 0.7 /100 | #252 | Tragic 33.3% |
Demographics Similar to Alaskan Athabascans by Bachelor's Degree
In terms of bachelor's degree, the demographic groups most similar to Alaskan Athabascans are Kiowa (28.8%, a difference of 0.080%), Creek (28.9%, a difference of 0.13%), Tsimshian (28.8%, a difference of 0.22%), Fijian (28.7%, a difference of 0.36%), and Yaqui (29.0%, a difference of 0.58%).
| Demographics | Rating | Rank | Bachelor's Degree |
| Shoshone | 0.0 /100 | #314 | Tragic 29.3% |
| Immigrants | Cabo Verde | 0.0 /100 | #315 | Tragic 29.2% |
| Sioux | 0.0 /100 | #316 | Tragic 29.1% |
| Colville | 0.0 /100 | #317 | Tragic 29.0% |
| Yaqui | 0.0 /100 | #318 | Tragic 29.0% |
| Creek | 0.0 /100 | #319 | Tragic 28.9% |
| Kiowa | 0.0 /100 | #320 | Tragic 28.8% |
| Alaskan Athabascans | 0.0 /100 | #321 | Tragic 28.8% |
| Tsimshian | 0.0 /100 | #322 | Tragic 28.8% |
| Fijians | 0.0 /100 | #323 | Tragic 28.7% |
| Dutch West Indians | 0.0 /100 | #324 | Tragic 28.5% |
| Pennsylvania Germans | 0.0 /100 | #325 | Tragic 28.4% |
| Apache | 0.0 /100 | #326 | Tragic 28.3% |
| Paiute | 0.0 /100 | #327 | Tragic 28.1% |
| Crow | 0.0 /100 | #328 | Tragic 27.7% |