Immigrants from Europe vs Mexican American Indian 7th Grade
COMPARE
Immigrants from Europe
Mexican American Indian
7th Grade
7th Grade Comparison
Immigrants from Europe
Mexican American Indians
96.5%
7TH GRADE
94.8/ 100
METRIC RATING
122nd/ 347
METRIC RANK
92.6%
7TH GRADE
0.0/ 100
METRIC RATING
335th/ 347
METRIC RANK
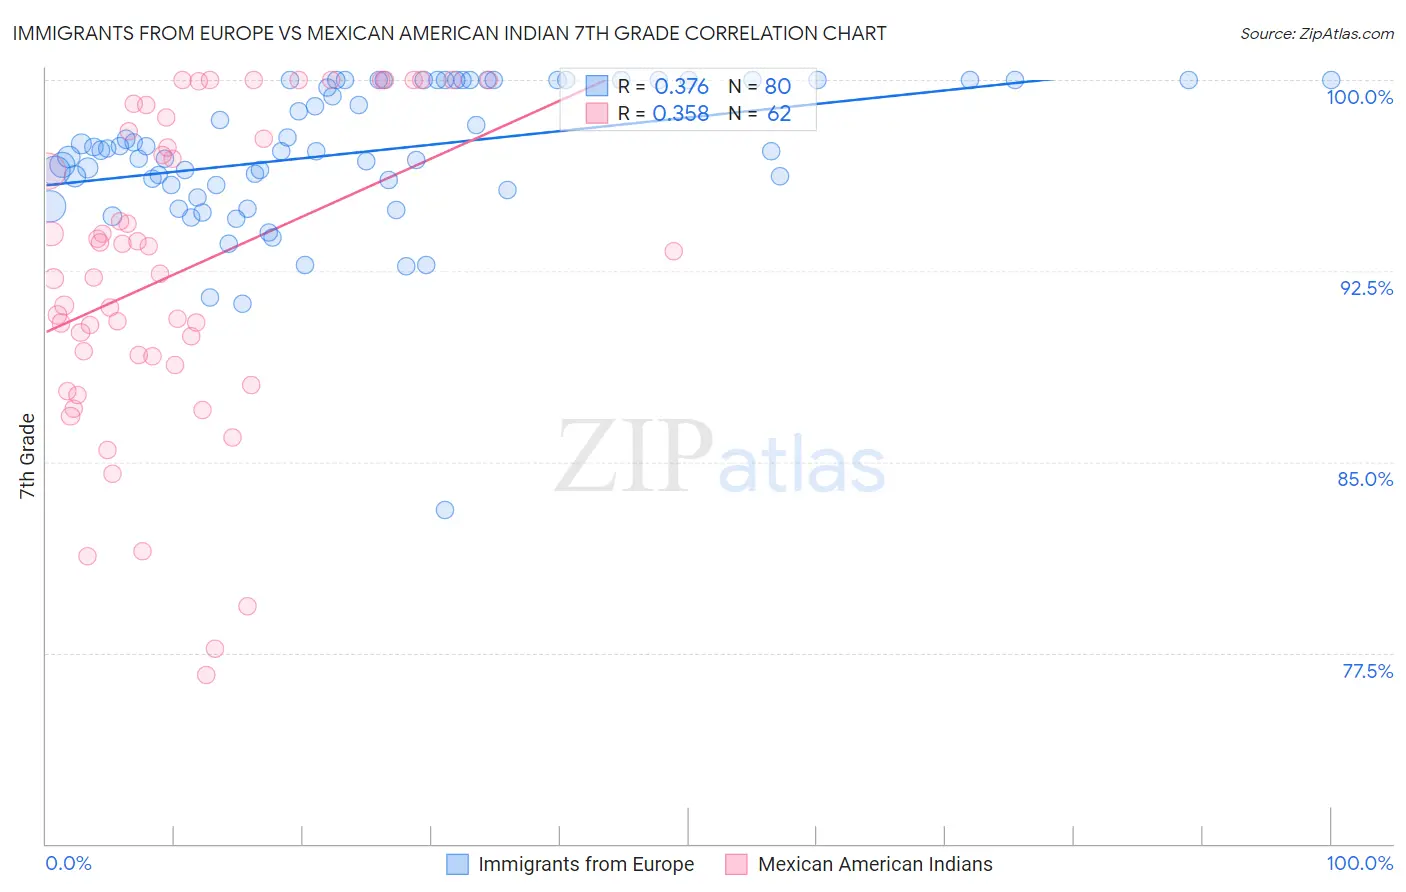
Immigrants from Europe vs Mexican American Indian 7th Grade Correlation Chart
The statistical analysis conducted on geographies consisting of 547,425,973 people shows a mild positive correlation between the proportion of Immigrants from Europe and percentage of population with at least 7th grade education in the United States with a correlation coefficient (R) of 0.376 and weighted average of 96.5%. Similarly, the statistical analysis conducted on geographies consisting of 317,621,104 people shows a mild positive correlation between the proportion of Mexican American Indians and percentage of population with at least 7th grade education in the United States with a correlation coefficient (R) of 0.358 and weighted average of 92.6%, a difference of 4.2%.
7th Grade Correlation Summary
| Measurement | Immigrants from Europe | Mexican American Indian |
| Minimum | 83.1% | 76.6% |
| Maximum | 100.0% | 100.0% |
| Range | 16.9% | 23.4% |
| Mean | 97.2% | 92.5% |
| Median | 97.2% | 92.8% |
| Interquartile 25% (IQ1) | 95.9% | 89.2% |
| Interquartile 75% (IQ3) | 100.0% | 98.0% |
| Interquartile Range (IQR) | 4.1% | 8.8% |
| Standard Deviation (Sample) | 2.8% | 6.1% |
| Standard Deviation (Population) | 2.8% | 6.0% |
Similar Demographics by 7th Grade
Demographics Similar to Immigrants from Europe by 7th Grade
In terms of 7th grade, the demographic groups most similar to Immigrants from Europe are Cheyenne (96.5%, a difference of 0.0%), Immigrants from France (96.5%, a difference of 0.0%), Immigrants from Norway (96.5%, a difference of 0.010%), Immigrants from Croatia (96.5%, a difference of 0.010%), and Immigrants from Switzerland (96.5%, a difference of 0.010%).
| Demographics | Rating | Rank | 7th Grade |
| Choctaw | 96.6 /100 | #115 | Exceptional 96.5% |
| Syrians | 96.6 /100 | #116 | Exceptional 96.5% |
| Immigrants | Moldova | 95.7 /100 | #117 | Exceptional 96.5% |
| Immigrants | Japan | 95.5 /100 | #118 | Exceptional 96.5% |
| Immigrants | Norway | 95.2 /100 | #119 | Exceptional 96.5% |
| Immigrants | Croatia | 95.0 /100 | #120 | Exceptional 96.5% |
| Cheyenne | 94.9 /100 | #121 | Exceptional 96.5% |
| Immigrants | Europe | 94.8 /100 | #122 | Exceptional 96.5% |
| Immigrants | France | 94.7 /100 | #123 | Exceptional 96.5% |
| Immigrants | Switzerland | 94.5 /100 | #124 | Exceptional 96.5% |
| Immigrants | Bulgaria | 94.0 /100 | #125 | Exceptional 96.4% |
| Palestinians | 93.5 /100 | #126 | Exceptional 96.4% |
| Immigrants | Bosnia and Herzegovina | 93.3 /100 | #127 | Exceptional 96.4% |
| Immigrants | Romania | 93.2 /100 | #128 | Exceptional 96.4% |
| Immigrants | North Macedonia | 93.1 /100 | #129 | Exceptional 96.4% |
Demographics Similar to Mexican American Indians by 7th Grade
In terms of 7th grade, the demographic groups most similar to Mexican American Indians are Immigrants from Honduras (92.5%, a difference of 0.070%), Immigrants from Yemen (92.6%, a difference of 0.10%), Immigrants from Armenia (92.7%, a difference of 0.18%), Hispanic or Latino (92.7%, a difference of 0.20%), and Honduran (92.9%, a difference of 0.34%).
| Demographics | Rating | Rank | 7th Grade |
| Immigrants | Nicaragua | 0.0 /100 | #328 | Tragic 93.0% |
| Immigrants | Azores | 0.0 /100 | #329 | Tragic 93.0% |
| Immigrants | Dominican Republic | 0.0 /100 | #330 | Tragic 92.9% |
| Hondurans | 0.0 /100 | #331 | Tragic 92.9% |
| Hispanics or Latinos | 0.0 /100 | #332 | Tragic 92.7% |
| Immigrants | Armenia | 0.0 /100 | #333 | Tragic 92.7% |
| Immigrants | Yemen | 0.0 /100 | #334 | Tragic 92.6% |
| Mexican American Indians | 0.0 /100 | #335 | Tragic 92.6% |
| Immigrants | Honduras | 0.0 /100 | #336 | Tragic 92.5% |
| Immigrants | Latin America | 0.0 /100 | #337 | Tragic 92.2% |
| Central Americans | 0.0 /100 | #338 | Tragic 92.1% |
| Mexicans | 0.0 /100 | #339 | Tragic 91.9% |
| Yakama | 0.0 /100 | #340 | Tragic 91.7% |
| Guatemalans | 0.0 /100 | #341 | Tragic 91.7% |
| Salvadorans | 0.0 /100 | #342 | Tragic 91.5% |