Immigrants from Europe vs Brazilian Professional Degree
COMPARE
Immigrants from Europe
Brazilian
Professional Degree
Professional Degree Comparison
Immigrants from Europe
Brazilians
5.6%
PROFESSIONAL DEGREE
100.0/ 100
METRIC RATING
59th/ 347
METRIC RANK
5.0%
PROFESSIONAL DEGREE
97.4/ 100
METRIC RATING
111th/ 347
METRIC RANK
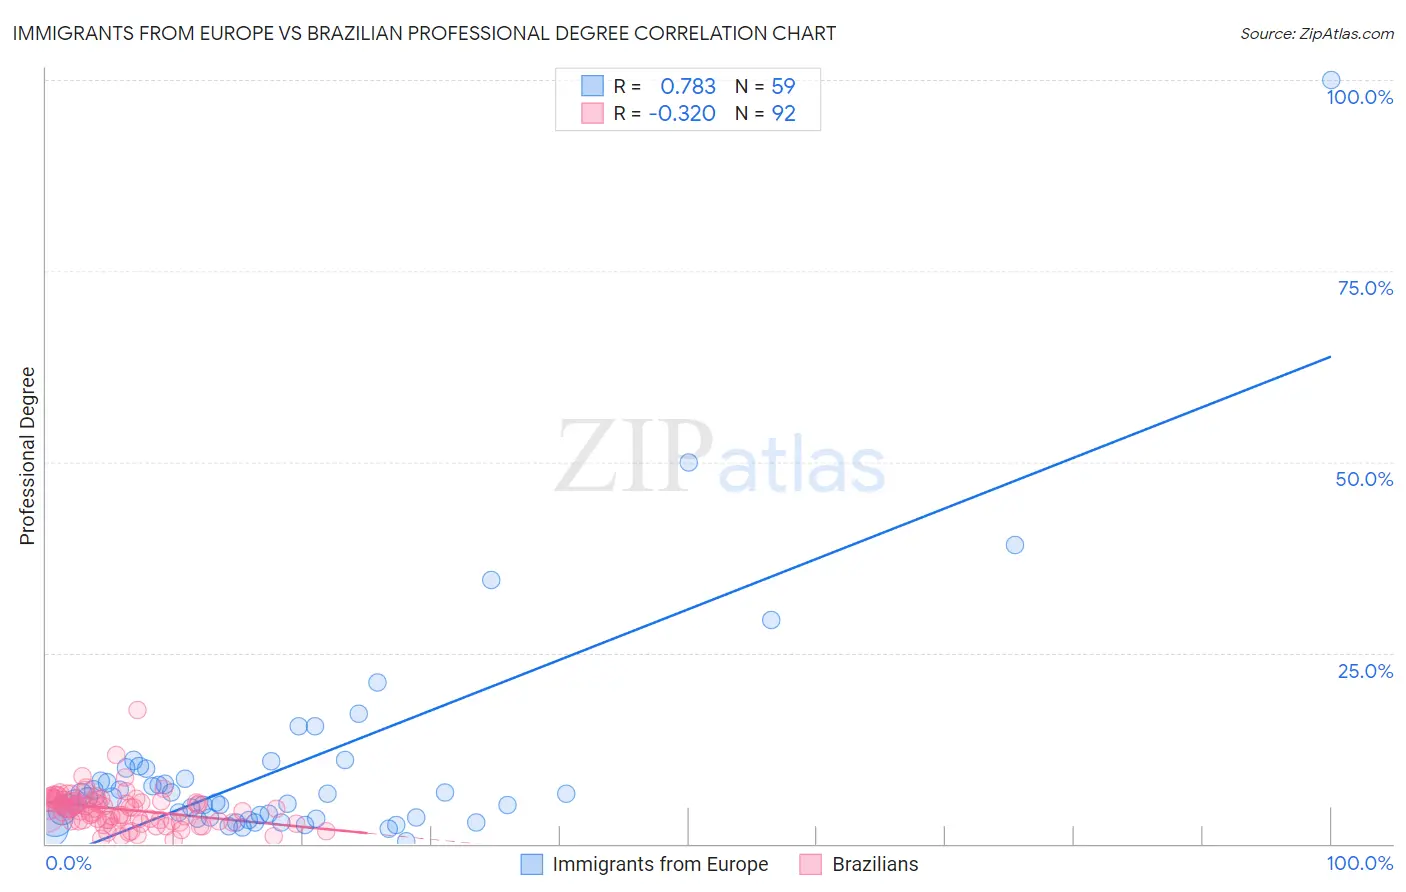
Immigrants from Europe vs Brazilian Professional Degree Correlation Chart
The statistical analysis conducted on geographies consisting of 543,310,657 people shows a strong positive correlation between the proportion of Immigrants from Europe and percentage of population with at least professional degree education in the United States with a correlation coefficient (R) of 0.783 and weighted average of 5.6%. Similarly, the statistical analysis conducted on geographies consisting of 323,483,336 people shows a mild negative correlation between the proportion of Brazilians and percentage of population with at least professional degree education in the United States with a correlation coefficient (R) of -0.320 and weighted average of 5.0%, a difference of 12.9%.
Professional Degree Correlation Summary
| Measurement | Immigrants from Europe | Brazilian |
| Minimum | 0.35% | 0.54% |
| Maximum | 100.0% | 17.5% |
| Range | 99.6% | 17.0% |
| Mean | 10.1% | 4.5% |
| Median | 6.0% | 4.6% |
| Interquartile 25% (IQ1) | 3.3% | 3.0% |
| Interquartile 75% (IQ3) | 9.9% | 5.7% |
| Interquartile Range (IQR) | 6.6% | 2.7% |
| Standard Deviation (Sample) | 15.1% | 2.4% |
| Standard Deviation (Population) | 14.9% | 2.4% |
Similar Demographics by Professional Degree
Demographics Similar to Immigrants from Europe by Professional Degree
In terms of professional degree, the demographic groups most similar to Immigrants from Europe are Bolivian (5.6%, a difference of 0.42%), Bulgarian (5.7%, a difference of 0.52%), Immigrants from Lithuania (5.6%, a difference of 1.1%), South African (5.7%, a difference of 1.1%), and Immigrants from Malaysia (5.7%, a difference of 1.4%).
| Demographics | Rating | Rank | Professional Degree |
| Immigrants | Serbia | 100.0 /100 | #52 | Exceptional 5.8% |
| Immigrants | Netherlands | 100.0 /100 | #53 | Exceptional 5.8% |
| Immigrants | Kuwait | 100.0 /100 | #54 | Exceptional 5.7% |
| Immigrants | Western Europe | 100.0 /100 | #55 | Exceptional 5.7% |
| Immigrants | Malaysia | 100.0 /100 | #56 | Exceptional 5.7% |
| South Africans | 100.0 /100 | #57 | Exceptional 5.7% |
| Bulgarians | 100.0 /100 | #58 | Exceptional 5.7% |
| Immigrants | Europe | 100.0 /100 | #59 | Exceptional 5.6% |
| Bolivians | 99.9 /100 | #60 | Exceptional 5.6% |
| Immigrants | Lithuania | 99.9 /100 | #61 | Exceptional 5.6% |
| Immigrants | Belarus | 99.9 /100 | #62 | Exceptional 5.5% |
| Asians | 99.9 /100 | #63 | Exceptional 5.5% |
| Immigrants | Asia | 99.9 /100 | #64 | Exceptional 5.5% |
| Immigrants | Bolivia | 99.9 /100 | #65 | Exceptional 5.5% |
| Immigrants | Kazakhstan | 99.9 /100 | #66 | Exceptional 5.5% |
Demographics Similar to Brazilians by Professional Degree
In terms of professional degree, the demographic groups most similar to Brazilians are Taiwanese (5.0%, a difference of 0.22%), Immigrants from Pakistan (5.0%, a difference of 0.24%), Immigrants from Morocco (5.0%, a difference of 0.69%), Lebanese (5.0%, a difference of 0.74%), and Moroccan (5.0%, a difference of 0.79%).
| Demographics | Rating | Rank | Professional Degree |
| Arabs | 98.2 /100 | #104 | Exceptional 5.0% |
| Immigrants | Uganda | 98.2 /100 | #105 | Exceptional 5.0% |
| Immigrants | Ukraine | 98.2 /100 | #106 | Exceptional 5.0% |
| Maltese | 98.1 /100 | #107 | Exceptional 5.0% |
| Immigrants | Southern Europe | 98.1 /100 | #108 | Exceptional 5.0% |
| British | 98.0 /100 | #109 | Exceptional 5.0% |
| Lebanese | 98.0 /100 | #110 | Exceptional 5.0% |
| Brazilians | 97.4 /100 | #111 | Exceptional 5.0% |
| Taiwanese | 97.3 /100 | #112 | Exceptional 5.0% |
| Immigrants | Pakistan | 97.2 /100 | #113 | Exceptional 5.0% |
| Immigrants | Morocco | 96.8 /100 | #114 | Exceptional 5.0% |
| Moroccans | 96.8 /100 | #115 | Exceptional 5.0% |
| Venezuelans | 96.3 /100 | #116 | Exceptional 4.9% |
| Immigrants | Syria | 96.0 /100 | #117 | Exceptional 4.9% |
| Croatians | 96.0 /100 | #118 | Exceptional 4.9% |