Immigrants from Ethiopia vs Immigrants from South America 8th Grade
COMPARE
Immigrants from Ethiopia
Immigrants from South America
8th Grade
8th Grade Comparison
Immigrants from Ethiopia
Immigrants from South America
95.0%
8TH GRADE
1.0/ 100
METRIC RATING
252nd/ 347
METRIC RANK
94.8%
8TH GRADE
0.2/ 100
METRIC RATING
272nd/ 347
METRIC RANK
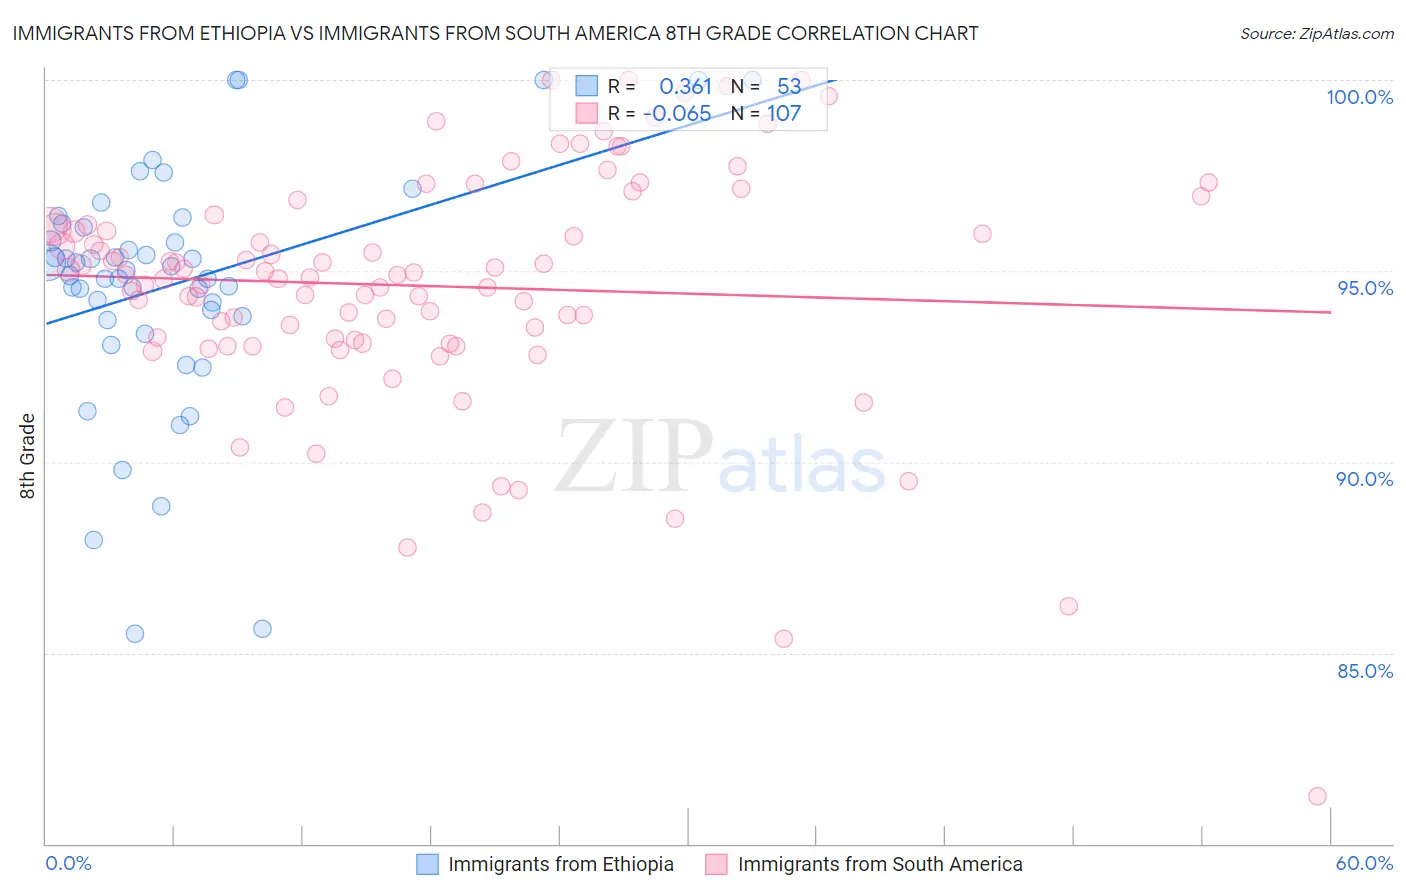
Immigrants from Ethiopia vs Immigrants from South America 8th Grade Correlation Chart
The statistical analysis conducted on geographies consisting of 211,528,629 people shows a mild positive correlation between the proportion of Immigrants from Ethiopia and percentage of population with at least 8th grade education in the United States with a correlation coefficient (R) of 0.361 and weighted average of 95.0%. Similarly, the statistical analysis conducted on geographies consisting of 486,312,594 people shows a slight negative correlation between the proportion of Immigrants from South America and percentage of population with at least 8th grade education in the United States with a correlation coefficient (R) of -0.065 and weighted average of 94.8%, a difference of 0.27%.
8th Grade Correlation Summary
| Measurement | Immigrants from Ethiopia | Immigrants from South America |
| Minimum | 85.5% | 81.2% |
| Maximum | 100.0% | 100.0% |
| Range | 14.5% | 18.8% |
| Mean | 94.7% | 94.6% |
| Median | 95.0% | 94.9% |
| Interquartile 25% (IQ1) | 93.8% | 93.2% |
| Interquartile 75% (IQ3) | 96.2% | 96.2% |
| Interquartile Range (IQR) | 2.4% | 3.0% |
| Standard Deviation (Sample) | 3.2% | 3.2% |
| Standard Deviation (Population) | 3.1% | 3.1% |
Demographics Similar to Immigrants from Ethiopia and Immigrants from South America by 8th Grade
In terms of 8th grade, the demographic groups most similar to Immigrants from Ethiopia are U.S. Virgin Islander (95.0%, a difference of 0.010%), Immigrants from Cameroon (95.0%, a difference of 0.030%), Immigrants from Somalia (95.0%, a difference of 0.050%), Colombian (95.0%, a difference of 0.060%), and Afghan (94.9%, a difference of 0.070%). Similarly, the demographic groups most similar to Immigrants from South America are Immigrants from Afghanistan (94.8%, a difference of 0.010%), Immigrants from Uzbekistan (94.8%, a difference of 0.020%), Immigrants from Thailand (94.8%, a difference of 0.040%), Immigrants from Ghana (94.8%, a difference of 0.060%), and Immigrants from Uruguay (94.8%, a difference of 0.060%).
| Demographics | Rating | Rank | 8th Grade |
| Immigrants | Ethiopia | 1.0 /100 | #252 | Tragic 95.0% |
| U.S. Virgin Islanders | 0.9 /100 | #253 | Tragic 95.0% |
| Immigrants | Cameroon | 0.8 /100 | #254 | Tragic 95.0% |
| Immigrants | Somalia | 0.7 /100 | #255 | Tragic 95.0% |
| Colombians | 0.7 /100 | #256 | Tragic 95.0% |
| Afghans | 0.6 /100 | #257 | Tragic 94.9% |
| Immigrants | Congo | 0.6 /100 | #258 | Tragic 94.9% |
| Ghanaians | 0.6 /100 | #259 | Tragic 94.9% |
| Immigrants | Jamaica | 0.6 /100 | #260 | Tragic 94.9% |
| Immigrants | Costa Rica | 0.5 /100 | #261 | Tragic 94.9% |
| Immigrants | Nigeria | 0.4 /100 | #262 | Tragic 94.9% |
| Immigrants | Hong Kong | 0.4 /100 | #263 | Tragic 94.9% |
| South Americans | 0.4 /100 | #264 | Tragic 94.9% |
| Yuman | 0.4 /100 | #265 | Tragic 94.9% |
| West Indians | 0.3 /100 | #266 | Tragic 94.8% |
| Immigrants | Ghana | 0.3 /100 | #267 | Tragic 94.8% |
| Immigrants | Uruguay | 0.3 /100 | #268 | Tragic 94.8% |
| Immigrants | Thailand | 0.2 /100 | #269 | Tragic 94.8% |
| Immigrants | Uzbekistan | 0.2 /100 | #270 | Tragic 94.8% |
| Immigrants | Afghanistan | 0.2 /100 | #271 | Tragic 94.8% |
| Immigrants | South America | 0.2 /100 | #272 | Tragic 94.8% |