Immigrants from Ethiopia vs Creek 6th Grade
COMPARE
Immigrants from Ethiopia
Creek
6th Grade
6th Grade Comparison
Immigrants from Ethiopia
Creek
96.5%
6TH GRADE
0.6/ 100
METRIC RATING
254th/ 347
METRIC RANK
97.7%
6TH GRADE
99.8/ 100
METRIC RATING
54th/ 347
METRIC RANK
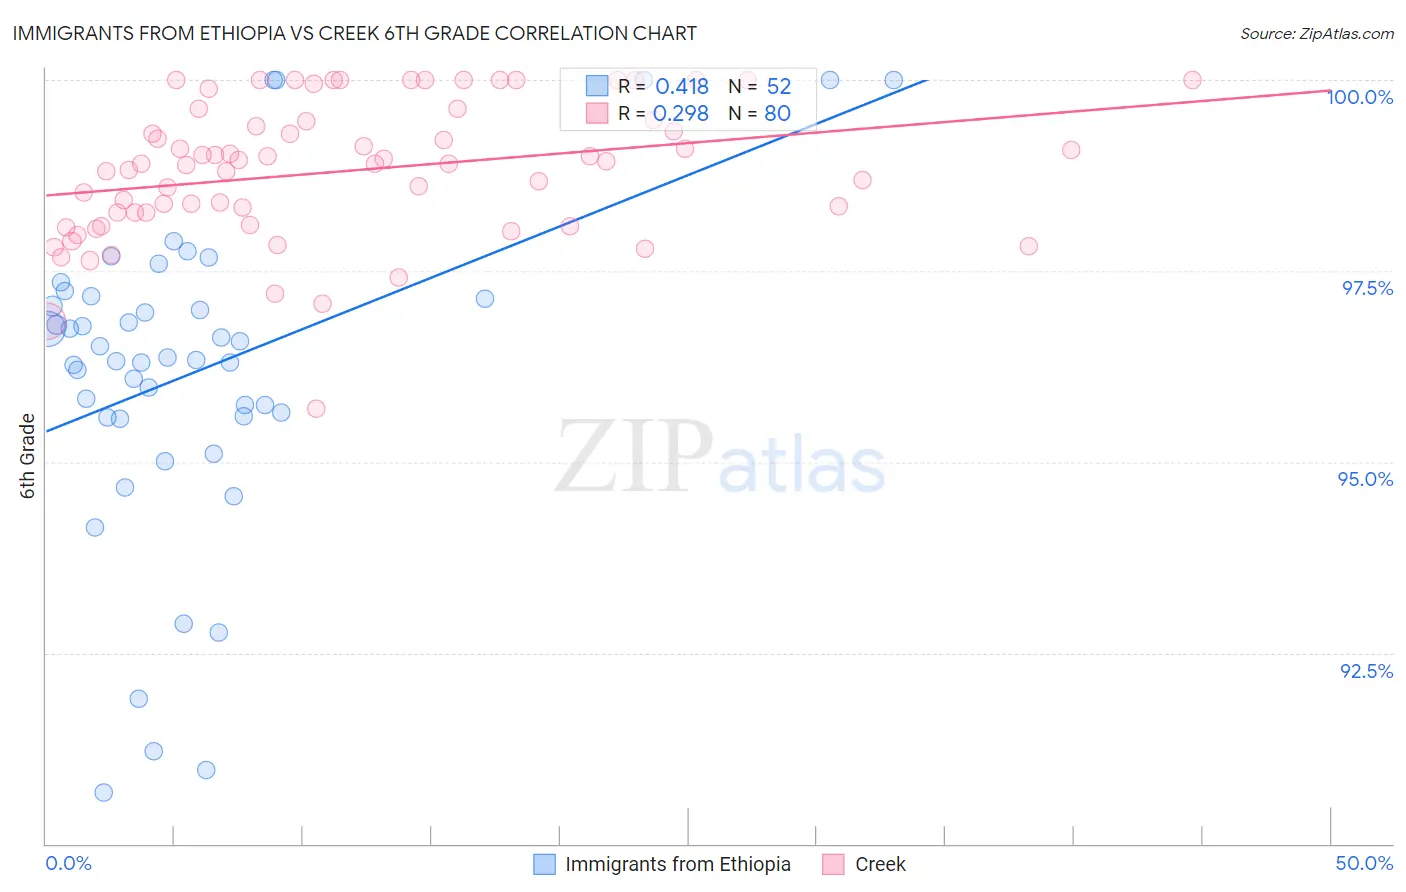
Immigrants from Ethiopia vs Creek 6th Grade Correlation Chart
The statistical analysis conducted on geographies consisting of 211,514,076 people shows a moderate positive correlation between the proportion of Immigrants from Ethiopia and percentage of population with at least 6th grade education in the United States with a correlation coefficient (R) of 0.418 and weighted average of 96.5%. Similarly, the statistical analysis conducted on geographies consisting of 178,480,663 people shows a weak positive correlation between the proportion of Creek and percentage of population with at least 6th grade education in the United States with a correlation coefficient (R) of 0.298 and weighted average of 97.7%, a difference of 1.3%.
6th Grade Correlation Summary
| Measurement | Immigrants from Ethiopia | Creek |
| Minimum | 90.7% | 95.7% |
| Maximum | 100.0% | 100.0% |
| Range | 9.3% | 4.3% |
| Mean | 96.2% | 98.8% |
| Median | 96.4% | 98.9% |
| Interquartile 25% (IQ1) | 95.6% | 98.2% |
| Interquartile 75% (IQ3) | 97.2% | 99.5% |
| Interquartile Range (IQR) | 1.6% | 1.3% |
| Standard Deviation (Sample) | 2.1% | 0.90% |
| Standard Deviation (Population) | 2.1% | 0.90% |
Similar Demographics by 6th Grade
Demographics Similar to Immigrants from Ethiopia by 6th Grade
In terms of 6th grade, the demographic groups most similar to Immigrants from Ethiopia are Jamaican (96.5%, a difference of 0.0%), Immigrants from Congo (96.5%, a difference of 0.0%), Immigrants from Uruguay (96.5%, a difference of 0.010%), U.S. Virgin Islander (96.5%, a difference of 0.010%), and Immigrants from Senegal (96.5%, a difference of 0.020%).
| Demographics | Rating | Rank | 6th Grade |
| Bolivians | 1.0 /100 | #247 | Tragic 96.5% |
| Tohono O'odham | 1.0 /100 | #248 | Tragic 96.5% |
| Colombians | 0.9 /100 | #249 | Tragic 96.5% |
| Immigrants | Middle Africa | 0.8 /100 | #250 | Tragic 96.5% |
| Immigrants | Senegal | 0.7 /100 | #251 | Tragic 96.5% |
| Immigrants | Uruguay | 0.6 /100 | #252 | Tragic 96.5% |
| Jamaicans | 0.6 /100 | #253 | Tragic 96.5% |
| Immigrants | Ethiopia | 0.6 /100 | #254 | Tragic 96.5% |
| Immigrants | Congo | 0.6 /100 | #255 | Tragic 96.5% |
| U.S. Virgin Islanders | 0.5 /100 | #256 | Tragic 96.5% |
| Taiwanese | 0.5 /100 | #257 | Tragic 96.5% |
| Immigrants | China | 0.4 /100 | #258 | Tragic 96.4% |
| South Americans | 0.4 /100 | #259 | Tragic 96.4% |
| Peruvians | 0.4 /100 | #260 | Tragic 96.4% |
| Immigrants | Sierra Leone | 0.4 /100 | #261 | Tragic 96.4% |
Demographics Similar to Creek by 6th Grade
In terms of 6th grade, the demographic groups most similar to Creek are Aleut (97.7%, a difference of 0.0%), Maltese (97.8%, a difference of 0.010%), Australian (97.8%, a difference of 0.010%), Slavic (97.8%, a difference of 0.010%), and Austrian (97.7%, a difference of 0.010%).
| Demographics | Rating | Rank | 6th Grade |
| Native Hawaiians | 99.9 /100 | #47 | Exceptional 97.8% |
| Celtics | 99.9 /100 | #48 | Exceptional 97.8% |
| Estonians | 99.8 /100 | #49 | Exceptional 97.8% |
| Immigrants | Scotland | 99.8 /100 | #50 | Exceptional 97.8% |
| Maltese | 99.8 /100 | #51 | Exceptional 97.8% |
| Australians | 99.8 /100 | #52 | Exceptional 97.8% |
| Slavs | 99.8 /100 | #53 | Exceptional 97.8% |
| Creek | 99.8 /100 | #54 | Exceptional 97.7% |
| Aleuts | 99.8 /100 | #55 | Exceptional 97.7% |
| Austrians | 99.8 /100 | #56 | Exceptional 97.7% |
| Whites/Caucasians | 99.8 /100 | #57 | Exceptional 97.7% |
| Greeks | 99.8 /100 | #58 | Exceptional 97.7% |
| Americans | 99.8 /100 | #59 | Exceptional 97.7% |
| Immigrants | Canada | 99.8 /100 | #60 | Exceptional 97.7% |
| Serbians | 99.7 /100 | #61 | Exceptional 97.7% |