Immigrants from Eritrea vs Immigrants from Moldova 4th Grade

COMPARE

Immigrants from Eritrea
Race
Ancestry
AfghanAfricanAlaska NativeAlaskan AthabascanAlbanianAleutAlsatianAmericanApacheArabArapahoArgentineanArmenianAssyrian/Chaldean/SyriacAustralianAustrianBahamianBangladeshiBarbadianBasqueBelgianBelizeanBermudanBhutaneseBlackfeetBolivianBrazilianBritishBritish West IndianBulgarianBurmeseCajunCambodianCanadianCape VerdeanCarpatho RusynCelticCentral AmericanCentral American IndianCherokeeCheyenneChickasawChileanChineseChippewaChoctawColombianColvilleComancheCosta RicanCreeCreekCroatianCrowCubanCypriotCzechCzechoslovakianDanishDelawareDominicanDutchDutch West IndianEastern EuropeanEcuadorianEgyptianEnglishEstonianEthiopianEuropeanFijianFilipinoFinnishFrenchFrench American IndianFrench CanadianGermanGerman RussianGhanaianGreekGuamanian/ChamorroGuatemalanGuyaneseHaitianHmongHonduranHopiHoumaHungarianIcelanderIndian (Asian)IndonesianInupiatIranianIraqiIrishIroquoisIsraeliItalianJamaicanJapaneseJordanianKenyanKiowaKoreanLaotianLatvianLebaneseLiberianLithuanianLumbeeLuxembourgerMacedonianMalaysianMalteseMarshalleseMenomineeMexicanMexican American IndianMongolianMoroccanNative HawaiianNavajoNepaleseNew ZealanderNicaraguanNigerianNorthern EuropeanNorwegianOkinawanOsageOttawaPaiutePakistaniPalestinianPanamanianParaguayanPennsylvania GermanPeruvianPimaPolishPortuguesePotawatomiPuebloPuerto RicanPuget Sound SalishRomanianRussianSalvadoranSamoanScandinavianScotch-IrishScottishSeminoleSenegaleseSerbianShoshoneSierra LeoneanSiouxSlavicSlovakSloveneSomaliSouth AfricanSouth AmericanSouth American IndianSoviet UnionSpaniardSpanishSpanish AmericanSpanish American IndianSri LankanSubsaharan AfricanSudaneseSwedishSwissSyrianTaiwaneseThaiTlingit-HaidaTohono O'OdhamTonganTrinidadian and TobagonianTsimshianTurkishU.S. Virgin IslanderUgandanUkrainianUruguayanUteVenezuelanVietnameseWelshWest IndianYakamaYaquiYugoslavianYumanYup'ikZimbabwean
Immigration
NonimmigrantsImmigrantsAfghanistanAfricaAlbaniaArgentinaArmeniaAsiaAustraliaAustriaBahamasBangladeshBarbadosBelarusBelgiumBelizeBoliviaBosnia and HerzegovinaBrazilBulgariaBurma/MyanmarCabo VerdeCambodiaCameroonCanadaCaribbeanCentral AmericaChileChinaColombiaCongoCosta RicaCroatiaCubaCzechoslovakiaDenmarkDominicaDominican RepublicEastern AfricaEastern AsiaEastern EuropeEcuadorEgyptEl SalvadorEnglandEritreaEthiopiaEuropeFijiFranceGermanyGhanaGreeceGrenadaGuatemalaGuyanaHaitiHondurasHong KongHungaryIndiaIndonesiaIranIraqIrelandIsraelItalyJamaicaJapanJordanKazakhstanKenyaKoreaKuwaitLaosLatin AmericaLatviaLebanonLiberiaLithuaniaMalaysiaMexicoMicronesiaMiddle AfricaMoroccoNepalNetherlandsNicaraguaNigeriaNorth AmericaNorth MacedoniaNorthern AfricaNorthern EuropeNorwayOceaniaPakistanPanamaPeruPhilippinesPolandPortugalRomaniaRussiaSaudi ArabiaScotlandSenegalSerbiaSierra LeoneSingaporeSomaliaSouth AfricaSouth AmericaSouth Central AsiaSouth Eastern AsiaSouthern EuropeSpainSri LankaSt. Vincent and the GrenadinesSudanSwedenSwitzerlandSyriaTaiwanThailandTrinidad and TobagoTurkeyUgandaUkraineUruguayUzbekistanVenezuelaVietnamWest IndiesWestern AfricaWestern AsiaWestern EuropeYemenZaireZimbabweAzores
Immigrants from Moldova
Race
Ancestry
AfghanAfricanAlaska NativeAlaskan AthabascanAlbanianAleutAlsatianAmericanApacheArabArapahoArgentineanArmenianAssyrian/Chaldean/SyriacAustralianAustrianBahamianBangladeshiBarbadianBasqueBelgianBelizeanBermudanBhutaneseBlackfeetBolivianBrazilianBritishBritish West IndianBulgarianBurmeseCajunCambodianCanadianCape VerdeanCarpatho RusynCelticCentral AmericanCentral American IndianCherokeeCheyenneChickasawChileanChineseChippewaChoctawColombianColvilleComancheCosta RicanCreeCreekCroatianCrowCubanCypriotCzechCzechoslovakianDanishDelawareDominicanDutchDutch West IndianEastern EuropeanEcuadorianEgyptianEnglishEstonianEthiopianEuropeanFijianFilipinoFinnishFrenchFrench American IndianFrench CanadianGermanGerman RussianGhanaianGreekGuamanian/ChamorroGuatemalanGuyaneseHaitianHmongHonduranHopiHoumaHungarianIcelanderIndian (Asian)IndonesianInupiatIranianIraqiIrishIroquoisIsraeliItalianJamaicanJapaneseJordanianKenyanKiowaKoreanLaotianLatvianLebaneseLiberianLithuanianLumbeeLuxembourgerMacedonianMalaysianMalteseMarshalleseMenomineeMexicanMexican American IndianMongolianMoroccanNative HawaiianNavajoNepaleseNew ZealanderNicaraguanNigerianNorthern EuropeanNorwegianOkinawanOsageOttawaPaiutePakistaniPalestinianPanamanianParaguayanPennsylvania GermanPeruvianPimaPolishPortuguesePotawatomiPuebloPuerto RicanPuget Sound SalishRomanianRussianSalvadoranSamoanScandinavianScotch-IrishScottishSeminoleSenegaleseSerbianShoshoneSierra LeoneanSiouxSlavicSlovakSloveneSomaliSouth AfricanSouth AmericanSouth American IndianSoviet UnionSpaniardSpanishSpanish AmericanSpanish American IndianSri LankanSubsaharan AfricanSudaneseSwedishSwissSyrianTaiwaneseThaiTlingit-HaidaTohono O'OdhamTonganTrinidadian and TobagonianTsimshianTurkishU.S. Virgin IslanderUgandanUkrainianUruguayanUteVenezuelanVietnameseWelshWest IndianYakamaYaquiYugoslavianYumanYup'ikZimbabwean
Immigration
NonimmigrantsImmigrantsAfghanistanAfricaAlbaniaArgentinaArmeniaAsiaAustraliaAustriaBahamasBangladeshBarbadosBelarusBelgiumBelizeBoliviaBosnia and HerzegovinaBrazilBulgariaBurma/MyanmarCabo VerdeCambodiaCameroonCanadaCaribbeanCentral AmericaChileChinaColombiaCongoCosta RicaCroatiaCubaCzechoslovakiaDenmarkDominicaDominican RepublicEastern AfricaEastern AsiaEastern EuropeEcuadorEgyptEl SalvadorEnglandEthiopiaEuropeFijiFranceGermanyGhanaGreeceGrenadaGuatemalaGuyanaHaitiHondurasHong KongHungaryIndiaIndonesiaIranIraqIrelandIsraelItalyJamaicaJapanJordanKazakhstanKenyaKoreaKuwaitLaosLatin AmericaLatviaLebanonLiberiaLithuaniaMalaysiaMexicoMicronesiaMiddle AfricaMoldovaMoroccoNepalNetherlandsNicaraguaNigeriaNorth AmericaNorth MacedoniaNorthern AfricaNorthern EuropeNorwayOceaniaPakistanPanamaPeruPhilippinesPolandPortugalRomaniaRussiaSaudi ArabiaScotlandSenegalSerbiaSierra LeoneSingaporeSomaliaSouth AfricaSouth AmericaSouth Central AsiaSouth Eastern AsiaSouthern EuropeSpainSri LankaSt. Vincent and the GrenadinesSudanSwedenSwitzerlandSyriaTaiwanThailandTrinidad and TobagoTurkeyUgandaUkraineUruguayUzbekistanVenezuelaVietnamWest IndiesWestern AfricaWestern AsiaWestern EuropeYemenZaireZimbabweAzores
4th Grade
Income
Poverty
Unemployment
Labor Participation
Family Structure
Vehicle Availability
Education Level
Disability

4th Grade Comparison

Immigrants from Eritrea

Immigrants from Moldova

Tragic
Excellent
96.7%
4TH GRADE
0.0/ 100
METRIC RATING
294th/ 347
METRIC RANK
97.7%
4TH GRADE
82.4/ 100
METRIC RATING
145th/ 347
METRIC RANK

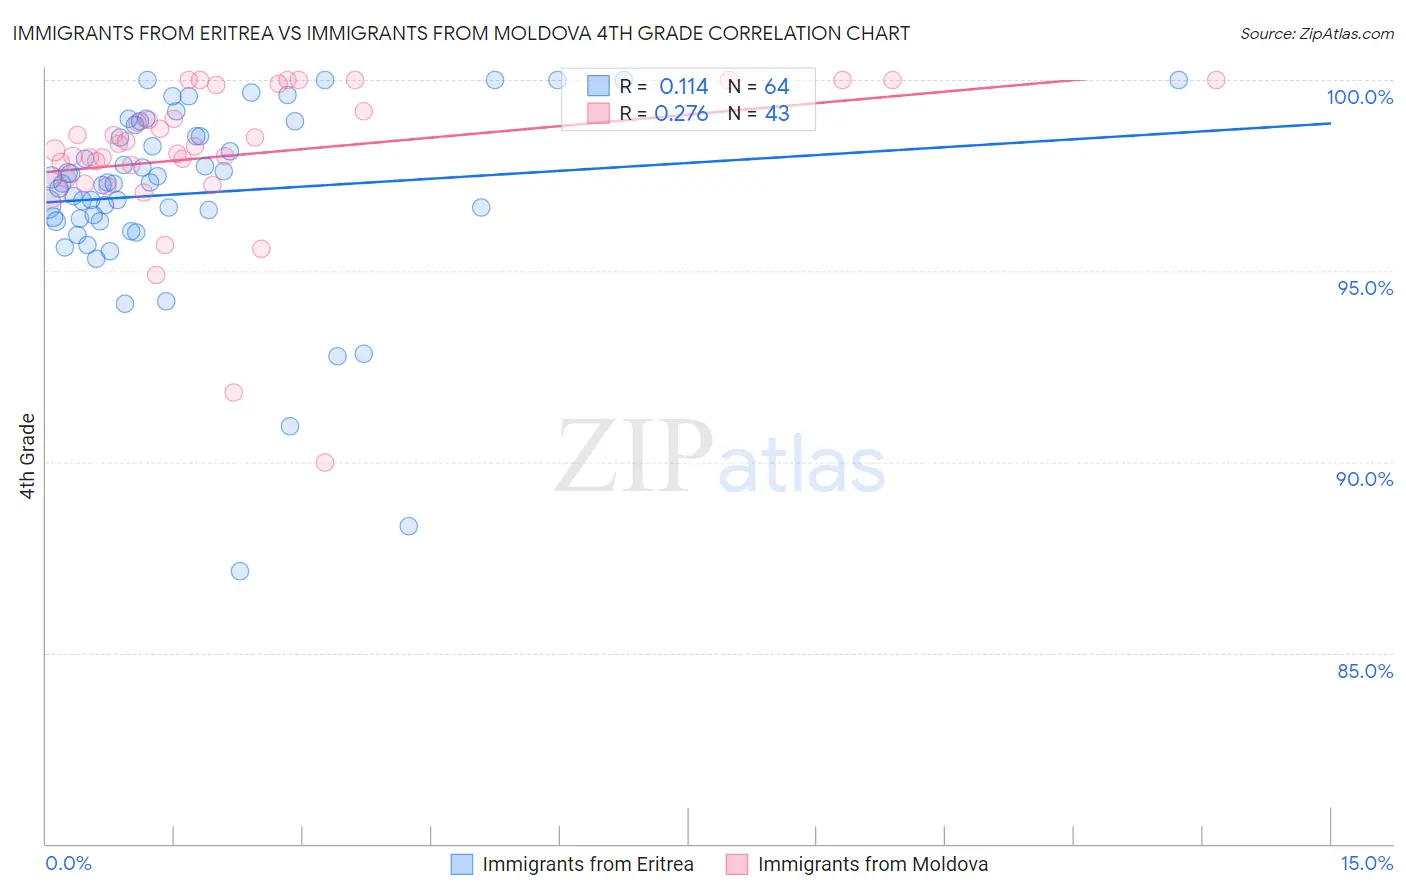
Immigrants from Eritrea vs Immigrants from Moldova 4th Grade Correlation Chart

The statistical analysis conducted on geographies consisting of 104,791,429 people shows a poor positive correlation between the proportion of Immigrants from Eritrea and percentage of population with at least 4th grade education in the United States with a correlation coefficient (R) of 0.114 and weighted average of 96.7%. Similarly, the statistical analysis conducted on geographies consisting of 124,398,501 people shows a weak positive correlation between the proportion of Immigrants from Moldova and percentage of population with at least 4th grade education in the United States with a correlation coefficient (R) of 0.276 and weighted average of 97.7%, a difference of 1.0%.
Immigrants from Eritrea vs Immigrants from Moldova 4th Grade

4th Grade Correlation Summary

MeasurementImmigrants from EritreaImmigrants from Moldova
Minimum87.1%90.0%
Maximum100.0%100.0%
Range12.9%10.0%
Mean97.0%98.0%
Median97.3%98.3%
Interquartile 25% (IQ1)96.3%97.4%
Interquartile 75% (IQ3)98.7%99.9%
Interquartile Range (IQR)2.3%2.4%
Standard Deviation (Sample)2.5%2.0%
Standard Deviation (Population)2.5%2.0%

Similar Demographics by 4th Grade

Demographics Similar to Immigrants from Eritrea by 4th Grade

In terms of 4th grade, the demographic groups most similar to Immigrants from Eritrea are Puerto Rican (96.7%, a difference of 0.020%), Immigrants from Portugal (96.6%, a difference of 0.020%), Somali (96.6%, a difference of 0.030%), Malaysian (96.7%, a difference of 0.040%), and Immigrants from Grenada (96.7%, a difference of 0.050%).
DemographicsRating | Rank4th Grade
Houma
0.0
/100
|
#287
Tragic
96.8%
Immigrants | Afghanistan
0.0
/100
|
#288
Tragic
96.8%
Immigrants | West Indies
0.0
/100
|
#289
Tragic
96.7%
British West Indians
0.0
/100
|
#290
Tragic
96.7%
Immigrants | Grenada
0.0
/100
|
#291
Tragic
96.7%
Malaysians
0.0
/100
|
#292
Tragic
96.7%
Puerto Ricans
0.0
/100
|
#293
Tragic
96.7%
Immigrants | Eritrea
0.0
/100
|
#294
Tragic
96.7%
Immigrants | Portugal
0.0
/100
|
#295
Tragic
96.6%
Somalis
0.0
/100
|
#296
Tragic
96.6%
Immigrants | Somalia
0.0
/100
|
#297
Tragic
96.5%
Haitians
0.0
/100
|
#298
Tragic
96.5%
Immigrants | Dominica
0.0
/100
|
#299
Tragic
96.5%
Immigrants | South Eastern Asia
0.0
/100
|
#300
Tragic
96.5%
Immigrants | Immigrants
0.0
/100
|
#301
Tragic
96.5%

Demographics Similar to Immigrants from Moldova by 4th Grade

In terms of 4th grade, the demographic groups most similar to Immigrants from Moldova are Burmese (97.7%, a difference of 0.0%), Spaniard (97.7%, a difference of 0.0%), Filipino (97.7%, a difference of 0.010%), Immigrants from Greece (97.7%, a difference of 0.010%), and Immigrants from North Macedonia (97.7%, a difference of 0.010%).
DemographicsRating | Rank4th Grade
Blackfeet
86.0
/100
|
#138
Excellent
97.7%
Seminole
84.7
/100
|
#139
Excellent
97.7%
Filipinos
84.0
/100
|
#140
Excellent
97.7%
Immigrants | Greece
83.8
/100
|
#141
Excellent
97.7%
Immigrants | North Macedonia
83.3
/100
|
#142
Excellent
97.7%
Burmese
82.8
/100
|
#143
Excellent
97.7%
Spaniards
82.7
/100
|
#144
Excellent
97.7%
Immigrants | Moldova
82.4
/100
|
#145
Excellent
97.7%
Jordanians
81.3
/100
|
#146
Excellent
97.7%
Ute
80.6
/100
|
#147
Excellent
97.7%
Hopi
80.6
/100
|
#148
Excellent
97.7%
Soviet Union
77.8
/100
|
#149
Good
97.6%
Immigrants | Israel
77.7
/100
|
#150
Good
97.6%
Alsatians
77.2
/100
|
#151
Good
97.6%
Immigrants | South Central Asia
76.2
/100
|
#152
Good
97.6%