Immigrants from England vs Honduran Nursery School
COMPARE
Immigrants from England
Honduran
Nursery School
Nursery School Comparison
Immigrants from England
Hondurans
98.3%
NURSERY SCHOOL
99.3/ 100
METRIC RATING
76th/ 347
METRIC RANK
97.0%
NURSERY SCHOOL
0.0/ 100
METRIC RATING
313th/ 347
METRIC RANK
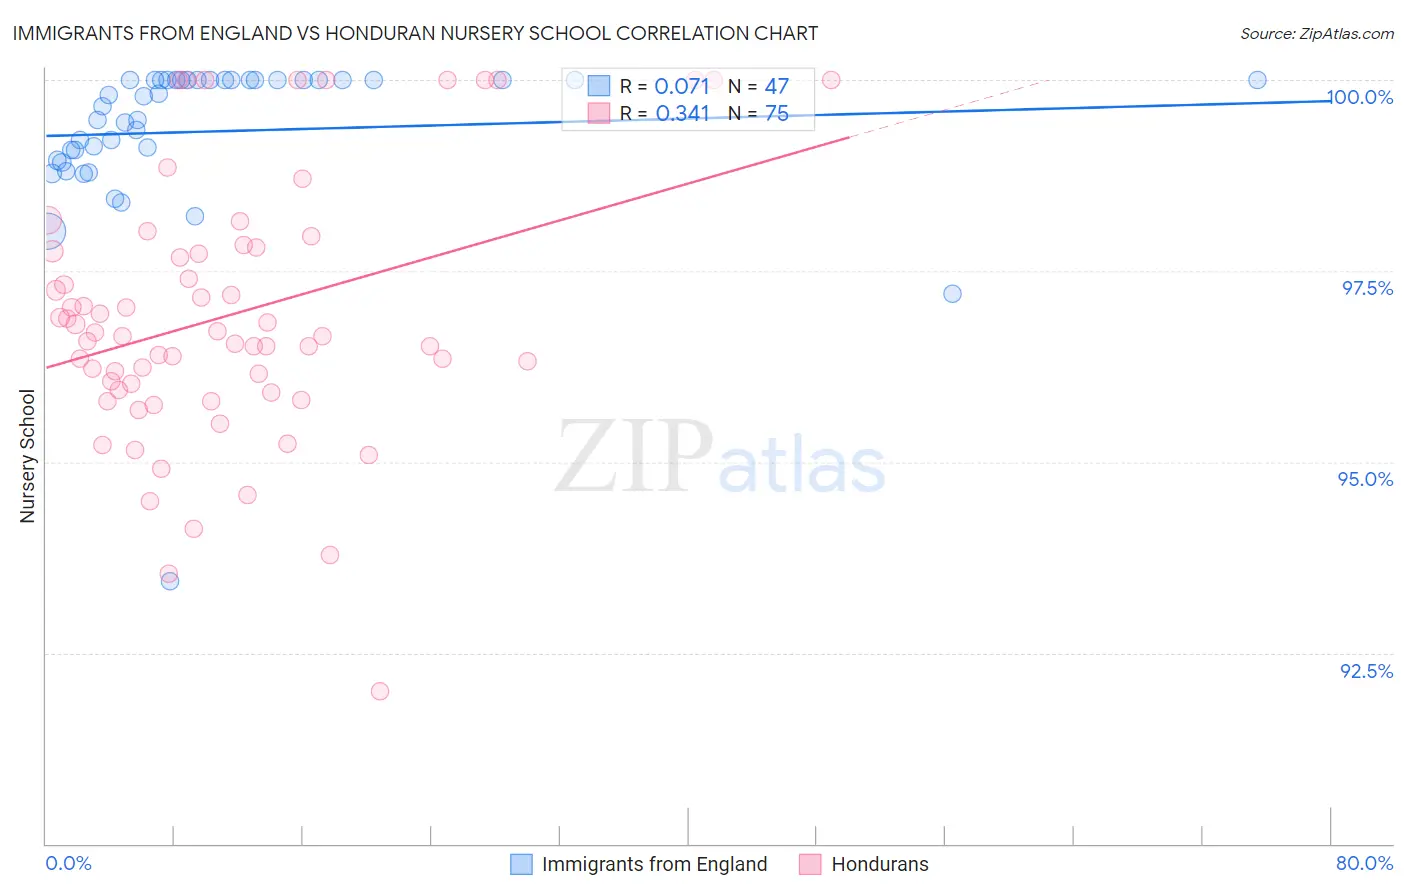
Immigrants from England vs Honduran Nursery School Correlation Chart
The statistical analysis conducted on geographies consisting of 391,898,018 people shows a slight positive correlation between the proportion of Immigrants from England and percentage of population with at least nursery school education in the United States with a correlation coefficient (R) of 0.071 and weighted average of 98.3%. Similarly, the statistical analysis conducted on geographies consisting of 357,783,041 people shows a mild positive correlation between the proportion of Hondurans and percentage of population with at least nursery school education in the United States with a correlation coefficient (R) of 0.341 and weighted average of 97.0%, a difference of 1.4%.
Nursery School Correlation Summary
| Measurement | Immigrants from England | Honduran |
| Minimum | 93.4% | 92.0% |
| Maximum | 100.0% | 100.0% |
| Range | 6.6% | 8.0% |
| Mean | 99.3% | 96.9% |
| Median | 99.8% | 96.6% |
| Interquartile 25% (IQ1) | 98.9% | 95.9% |
| Interquartile 75% (IQ3) | 100.0% | 97.8% |
| Interquartile Range (IQR) | 1.1% | 1.9% |
| Standard Deviation (Sample) | 1.1% | 1.7% |
| Standard Deviation (Population) | 1.1% | 1.7% |
Similar Demographics by Nursery School
Demographics Similar to Immigrants from England by Nursery School
In terms of nursery school, the demographic groups most similar to Immigrants from England are Cherokee (98.3%, a difference of 0.0%), Immigrants from Lithuania (98.3%, a difference of 0.0%), Delaware (98.3%, a difference of 0.0%), Immigrants from Belgium (98.3%, a difference of 0.0%), and Cajun (98.4%, a difference of 0.010%).
| Demographics | Rating | Rank | Nursery School |
| Immigrants | Austria | 99.6 /100 | #69 | Exceptional 98.4% |
| Cheyenne | 99.6 /100 | #70 | Exceptional 98.4% |
| Serbians | 99.6 /100 | #71 | Exceptional 98.4% |
| Chickasaw | 99.6 /100 | #72 | Exceptional 98.4% |
| Cajuns | 99.4 /100 | #73 | Exceptional 98.4% |
| Immigrants | Netherlands | 99.4 /100 | #74 | Exceptional 98.4% |
| Cherokee | 99.3 /100 | #75 | Exceptional 98.3% |
| Immigrants | England | 99.3 /100 | #76 | Exceptional 98.3% |
| Immigrants | Lithuania | 99.3 /100 | #77 | Exceptional 98.3% |
| Delaware | 99.3 /100 | #78 | Exceptional 98.3% |
| Immigrants | Belgium | 99.3 /100 | #79 | Exceptional 98.3% |
| Shoshone | 99.3 /100 | #80 | Exceptional 98.3% |
| Icelanders | 99.2 /100 | #81 | Exceptional 98.3% |
| Potawatomi | 99.2 /100 | #82 | Exceptional 98.3% |
| Osage | 99.1 /100 | #83 | Exceptional 98.3% |
Demographics Similar to Hondurans by Nursery School
In terms of nursery school, the demographic groups most similar to Hondurans are Cape Verdean (97.0%, a difference of 0.010%), Immigrants from Nicaragua (96.9%, a difference of 0.010%), Immigrants from Belize (96.9%, a difference of 0.010%), Sri Lankan (97.0%, a difference of 0.020%), and Immigrants from Ecuador (96.9%, a difference of 0.020%).
| Demographics | Rating | Rank | Nursery School |
| Belizeans | 0.0 /100 | #306 | Tragic 97.0% |
| Hispanics or Latinos | 0.0 /100 | #307 | Tragic 97.0% |
| Immigrants | Haiti | 0.0 /100 | #308 | Tragic 97.0% |
| Immigrants | Somalia | 0.0 /100 | #309 | Tragic 97.0% |
| Guyanese | 0.0 /100 | #310 | Tragic 97.0% |
| Immigrants | Azores | 0.0 /100 | #311 | Tragic 97.0% |
| Sri Lankans | 0.0 /100 | #312 | Tragic 97.0% |
| Hondurans | 0.0 /100 | #313 | Tragic 97.0% |
| Cape Verdeans | 0.0 /100 | #314 | Tragic 97.0% |
| Immigrants | Nicaragua | 0.0 /100 | #315 | Tragic 96.9% |
| Immigrants | Belize | 0.0 /100 | #316 | Tragic 96.9% |
| Immigrants | Ecuador | 0.0 /100 | #317 | Tragic 96.9% |
| Immigrants | Guyana | 0.0 /100 | #318 | Tragic 96.9% |
| Immigrants | Laos | 0.0 /100 | #319 | Tragic 96.9% |
| Immigrants | Burma/Myanmar | 0.0 /100 | #320 | Tragic 96.9% |