Immigrants from El Salvador vs Immigrants from Singapore 12th Grade, No Diploma
COMPARE
Immigrants from El Salvador
Immigrants from Singapore
12th Grade, No Diploma
12th Grade, No Diploma Comparison
Immigrants from El Salvador
Immigrants from Singapore
83.6%
12TH GRADE, NO DIPLOMA
0.0/ 100
METRIC RATING
343rd/ 347
METRIC RANK
93.3%
12TH GRADE, NO DIPLOMA
99.9/ 100
METRIC RATING
18th/ 347
METRIC RANK
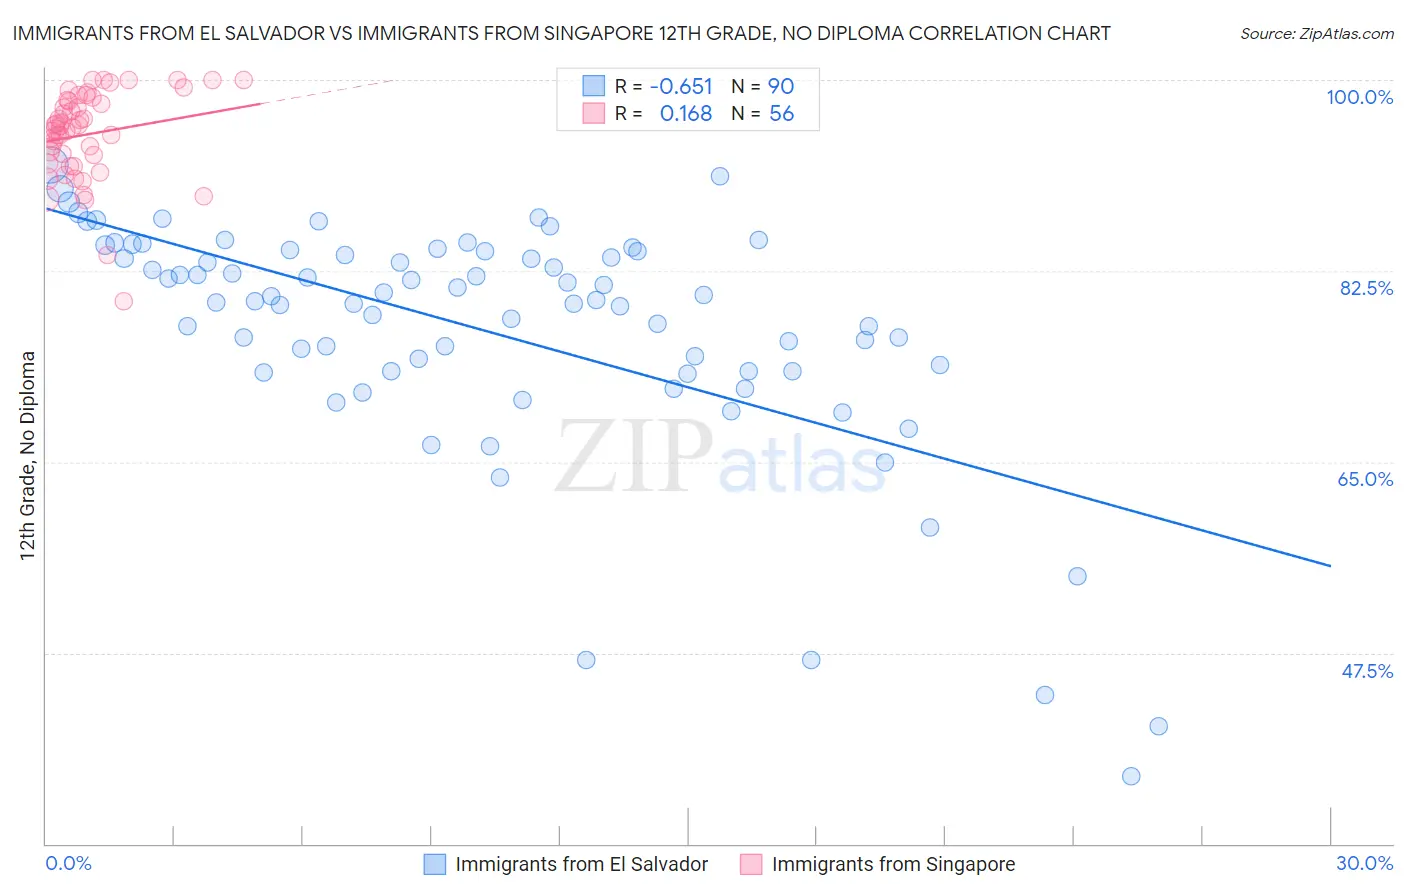
Immigrants from El Salvador vs Immigrants from Singapore 12th Grade, No Diploma Correlation Chart
The statistical analysis conducted on geographies consisting of 357,852,938 people shows a significant negative correlation between the proportion of Immigrants from El Salvador and percentage of population with at least 12th grade (no diploma) education in the United States with a correlation coefficient (R) of -0.651 and weighted average of 83.6%. Similarly, the statistical analysis conducted on geographies consisting of 137,521,094 people shows a poor positive correlation between the proportion of Immigrants from Singapore and percentage of population with at least 12th grade (no diploma) education in the United States with a correlation coefficient (R) of 0.168 and weighted average of 93.3%, a difference of 11.6%.
12th Grade, No Diploma Correlation Summary
| Measurement | Immigrants from El Salvador | Immigrants from Singapore |
| Minimum | 36.2% | 79.8% |
| Maximum | 92.2% | 100.0% |
| Range | 56.0% | 20.2% |
| Mean | 77.1% | 95.0% |
| Median | 79.8% | 95.7% |
| Interquartile 25% (IQ1) | 73.3% | 92.7% |
| Interquartile 75% (IQ3) | 84.3% | 98.1% |
| Interquartile Range (IQR) | 11.0% | 5.4% |
| Standard Deviation (Sample) | 10.9% | 4.1% |
| Standard Deviation (Population) | 10.9% | 4.0% |
Similar Demographics by 12th Grade, No Diploma
Demographics Similar to Immigrants from El Salvador by 12th Grade, No Diploma
In terms of 12th grade, no diploma, the demographic groups most similar to Immigrants from El Salvador are Houma (83.7%, a difference of 0.16%), Immigrants from Guatemala (84.0%, a difference of 0.51%), Mexican (84.1%, a difference of 0.65%), Immigrants from Central America (83.0%, a difference of 0.74%), and Spanish American Indian (82.9%, a difference of 0.80%).
| Demographics | Rating | Rank | 12th Grade, No Diploma |
| Immigrants | Latin America | 0.0 /100 | #333 | Tragic 85.0% |
| Immigrants | Dominican Republic | 0.0 /100 | #334 | Tragic 84.9% |
| Immigrants | Yemen | 0.0 /100 | #335 | Tragic 84.8% |
| Tohono O'odham | 0.0 /100 | #336 | Tragic 84.7% |
| Pima | 0.0 /100 | #337 | Tragic 84.6% |
| Guatemalans | 0.0 /100 | #338 | Tragic 84.6% |
| Salvadorans | 0.0 /100 | #339 | Tragic 84.5% |
| Mexicans | 0.0 /100 | #340 | Tragic 84.1% |
| Immigrants | Guatemala | 0.0 /100 | #341 | Tragic 84.0% |
| Houma | 0.0 /100 | #342 | Tragic 83.7% |
| Immigrants | El Salvador | 0.0 /100 | #343 | Tragic 83.6% |
| Immigrants | Central America | 0.0 /100 | #344 | Tragic 83.0% |
| Spanish American Indians | 0.0 /100 | #345 | Tragic 82.9% |
| Yakama | 0.0 /100 | #346 | Tragic 82.5% |
| Immigrants | Mexico | 0.0 /100 | #347 | Tragic 82.4% |
Demographics Similar to Immigrants from Singapore by 12th Grade, No Diploma
In terms of 12th grade, no diploma, the demographic groups most similar to Immigrants from Singapore are German (93.3%, a difference of 0.020%), Luxembourger (93.3%, a difference of 0.030%), Maltese (93.3%, a difference of 0.050%), Filipino (93.2%, a difference of 0.050%), and Italian (93.2%, a difference of 0.070%).
| Demographics | Rating | Rank | 12th Grade, No Diploma |
| Poles | 100.0 /100 | #11 | Exceptional 93.5% |
| Eastern Europeans | 100.0 /100 | #12 | Exceptional 93.5% |
| Danes | 100.0 /100 | #13 | Exceptional 93.5% |
| Bulgarians | 100.0 /100 | #14 | Exceptional 93.5% |
| Finns | 100.0 /100 | #15 | Exceptional 93.4% |
| Maltese | 100.0 /100 | #16 | Exceptional 93.3% |
| Luxembourgers | 100.0 /100 | #17 | Exceptional 93.3% |
| Immigrants | Singapore | 99.9 /100 | #18 | Exceptional 93.3% |
| Germans | 99.9 /100 | #19 | Exceptional 93.3% |
| Filipinos | 99.9 /100 | #20 | Exceptional 93.2% |
| Italians | 99.9 /100 | #21 | Exceptional 93.2% |
| Estonians | 99.9 /100 | #22 | Exceptional 93.2% |
| Scandinavians | 99.9 /100 | #23 | Exceptional 93.2% |
| Thais | 99.9 /100 | #24 | Exceptional 93.2% |
| Czechs | 99.9 /100 | #25 | Exceptional 93.2% |