Immigrants from El Salvador vs Crow Doctorate Degree
COMPARE
Immigrants from El Salvador
Crow
Doctorate Degree
Doctorate Degree Comparison
Immigrants from El Salvador
Crow
1.4%
DOCTORATE DEGREE
0.3/ 100
METRIC RATING
288th/ 347
METRIC RANK
1.5%
DOCTORATE DEGREE
0.5/ 100
METRIC RATING
269th/ 347
METRIC RANK
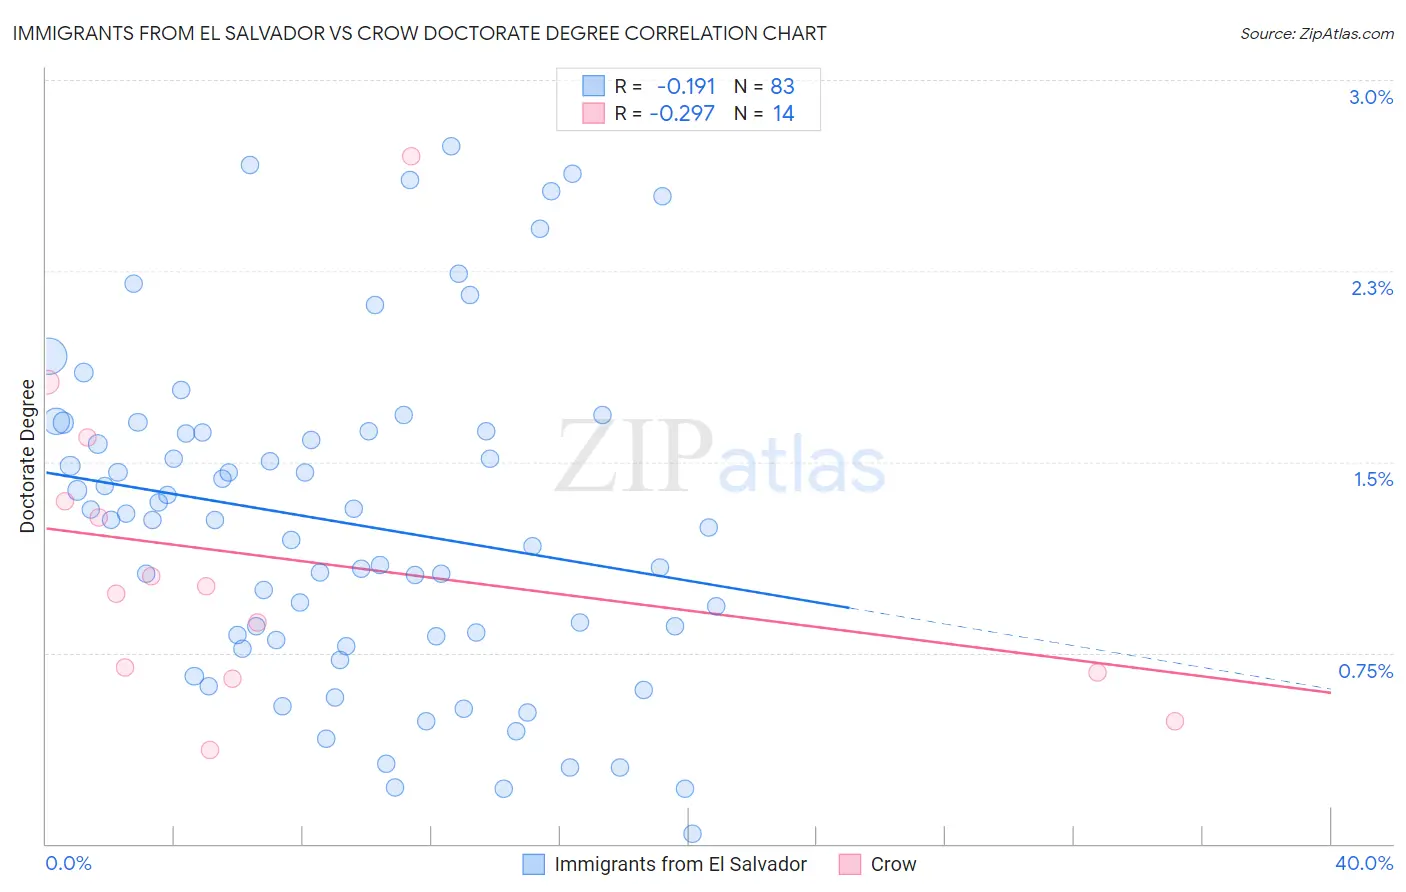
Immigrants from El Salvador vs Crow Doctorate Degree Correlation Chart
The statistical analysis conducted on geographies consisting of 353,263,202 people shows a poor negative correlation between the proportion of Immigrants from El Salvador and percentage of population with at least doctorate degree education in the United States with a correlation coefficient (R) of -0.191 and weighted average of 1.4%. Similarly, the statistical analysis conducted on geographies consisting of 58,797,777 people shows a weak negative correlation between the proportion of Crow and percentage of population with at least doctorate degree education in the United States with a correlation coefficient (R) of -0.297 and weighted average of 1.5%, a difference of 2.0%.
Doctorate Degree Correlation Summary
| Measurement | Immigrants from El Salvador | Crow |
| Minimum | 0.038% | 0.37% |
| Maximum | 2.7% | 2.7% |
| Range | 2.7% | 2.3% |
| Mean | 1.3% | 1.1% |
| Median | 1.3% | 1.00% |
| Interquartile 25% (IQ1) | 0.80% | 0.67% |
| Interquartile 75% (IQ3) | 1.6% | 1.3% |
| Interquartile Range (IQR) | 0.82% | 0.67% |
| Standard Deviation (Sample) | 0.65% | 0.62% |
| Standard Deviation (Population) | 0.64% | 0.60% |
Demographics Similar to Immigrants from El Salvador and Crow by Doctorate Degree
In terms of doctorate degree, the demographic groups most similar to Immigrants from El Salvador are Cajun (1.5%, a difference of 0.18%), Cherokee (1.5%, a difference of 0.34%), Malaysian (1.5%, a difference of 0.52%), Jamaican (1.5%, a difference of 0.55%), and Central American (1.5%, a difference of 0.59%). Similarly, the demographic groups most similar to Crow are Salvadoran (1.5%, a difference of 0.030%), U.S. Virgin Islander (1.5%, a difference of 0.090%), Immigrants from Trinidad and Tobago (1.5%, a difference of 0.10%), Immigrants from Barbados (1.5%, a difference of 0.19%), and Sioux (1.5%, a difference of 0.30%).
| Demographics | Rating | Rank | Doctorate Degree |
| U.S. Virgin Islanders | 0.5 /100 | #268 | Tragic 1.5% |
| Crow | 0.5 /100 | #269 | Tragic 1.5% |
| Salvadorans | 0.5 /100 | #270 | Tragic 1.5% |
| Immigrants | Trinidad and Tobago | 0.5 /100 | #271 | Tragic 1.5% |
| Immigrants | Barbados | 0.4 /100 | #272 | Tragic 1.5% |
| Sioux | 0.4 /100 | #273 | Tragic 1.5% |
| Yaqui | 0.4 /100 | #274 | Tragic 1.5% |
| Aleuts | 0.4 /100 | #275 | Tragic 1.5% |
| Paiute | 0.4 /100 | #276 | Tragic 1.5% |
| Bahamians | 0.4 /100 | #277 | Tragic 1.5% |
| Hawaiians | 0.4 /100 | #278 | Tragic 1.5% |
| Marshallese | 0.4 /100 | #279 | Tragic 1.5% |
| Ecuadorians | 0.4 /100 | #280 | Tragic 1.5% |
| Tohono O'odham | 0.4 /100 | #281 | Tragic 1.5% |
| British West Indians | 0.3 /100 | #282 | Tragic 1.5% |
| Central Americans | 0.3 /100 | #283 | Tragic 1.5% |
| Jamaicans | 0.3 /100 | #284 | Tragic 1.5% |
| Malaysians | 0.3 /100 | #285 | Tragic 1.5% |
| Cherokee | 0.3 /100 | #286 | Tragic 1.5% |
| Cajuns | 0.3 /100 | #287 | Tragic 1.5% |
| Immigrants | El Salvador | 0.3 /100 | #288 | Tragic 1.4% |