Immigrants from Egypt vs Venezuelan College, 1 year or more
COMPARE
Immigrants from Egypt
Venezuelan
College, 1 year or more
College, 1 year or more Comparison
Immigrants from Egypt
Venezuelans
62.4%
COLLEGE, 1 YEAR OR MORE
97.8/ 100
METRIC RATING
92nd/ 347
METRIC RANK
61.3%
COLLEGE, 1 YEAR OR MORE
92.1/ 100
METRIC RATING
124th/ 347
METRIC RANK
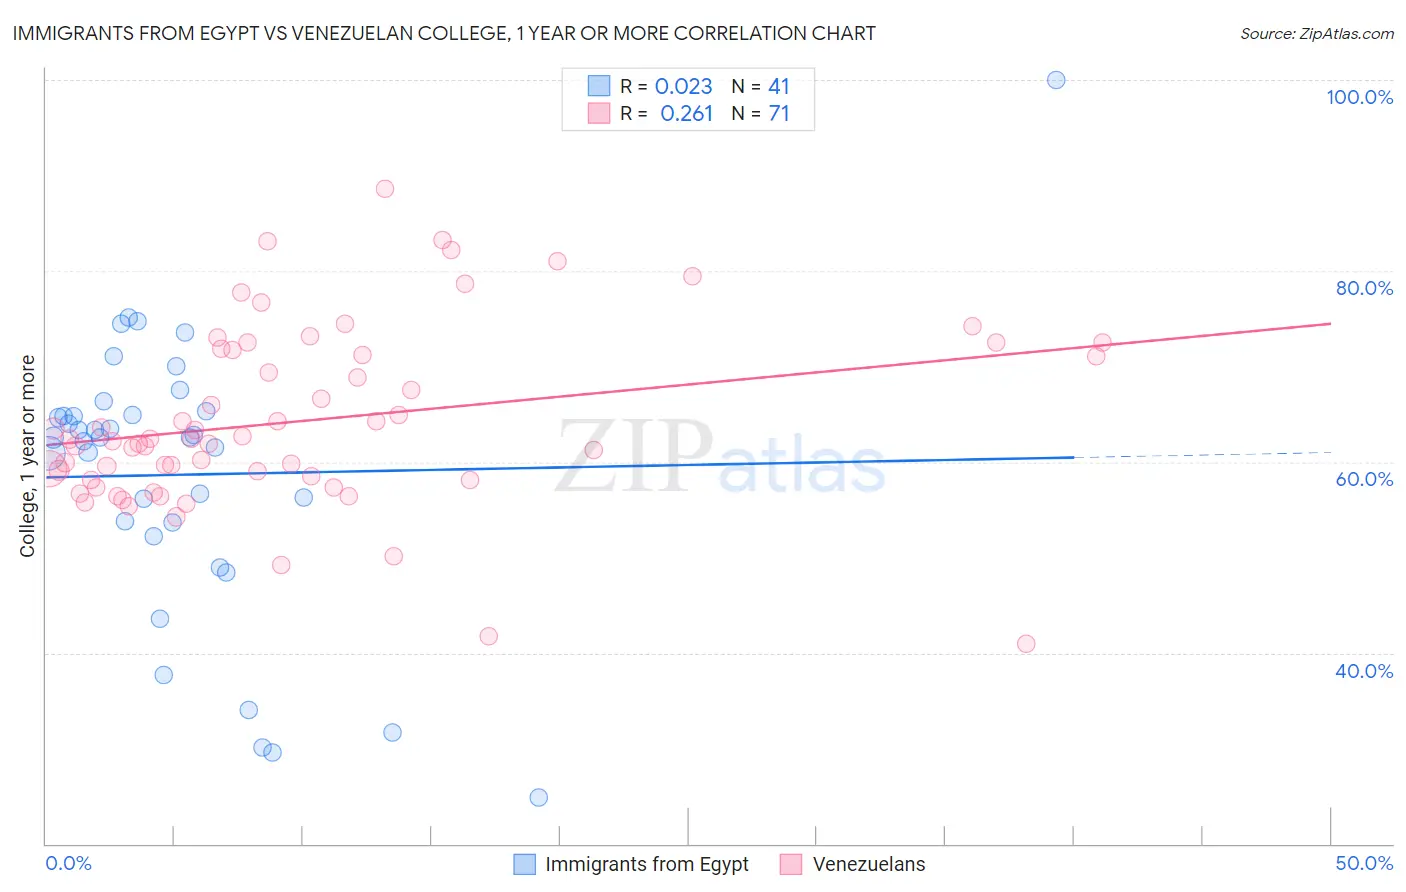
Immigrants from Egypt vs Venezuelan College, 1 year or more Correlation Chart
The statistical analysis conducted on geographies consisting of 245,485,794 people shows no correlation between the proportion of Immigrants from Egypt and percentage of population with at least college, 1 year or more education in the United States with a correlation coefficient (R) of 0.023 and weighted average of 62.4%. Similarly, the statistical analysis conducted on geographies consisting of 306,322,543 people shows a weak positive correlation between the proportion of Venezuelans and percentage of population with at least college, 1 year or more education in the United States with a correlation coefficient (R) of 0.261 and weighted average of 61.3%, a difference of 1.7%.
College, 1 year or more Correlation Summary
| Measurement | Immigrants from Egypt | Venezuelan |
| Minimum | 24.8% | 41.0% |
| Maximum | 100.0% | 88.6% |
| Range | 75.2% | 47.7% |
| Mean | 58.7% | 64.3% |
| Median | 62.6% | 62.4% |
| Interquartile 25% (IQ1) | 53.0% | 58.1% |
| Interquartile 75% (IQ3) | 65.1% | 71.7% |
| Interquartile Range (IQR) | 12.1% | 13.6% |
| Standard Deviation (Sample) | 14.7% | 9.4% |
| Standard Deviation (Population) | 14.5% | 9.3% |
Similar Demographics by College, 1 year or more
Demographics Similar to Immigrants from Egypt by College, 1 year or more
In terms of college, 1 year or more, the demographic groups most similar to Immigrants from Egypt are Immigrants from Eastern Europe (62.4%, a difference of 0.010%), Romanian (62.4%, a difference of 0.030%), Immigrants from Croatia (62.3%, a difference of 0.090%), Immigrants from Western Asia (62.5%, a difference of 0.11%), and British (62.3%, a difference of 0.19%).
| Demographics | Rating | Rank | College, 1 year or more |
| Immigrants | Pakistan | 98.6 /100 | #85 | Exceptional 62.8% |
| Immigrants | Western Europe | 98.6 /100 | #86 | Exceptional 62.7% |
| Immigrants | Hungary | 98.6 /100 | #87 | Exceptional 62.7% |
| Greeks | 98.3 /100 | #88 | Exceptional 62.6% |
| Immigrants | Ethiopia | 98.2 /100 | #89 | Exceptional 62.6% |
| Immigrants | Western Asia | 97.9 /100 | #90 | Exceptional 62.5% |
| Immigrants | Eastern Europe | 97.8 /100 | #91 | Exceptional 62.4% |
| Immigrants | Egypt | 97.8 /100 | #92 | Exceptional 62.4% |
| Romanians | 97.7 /100 | #93 | Exceptional 62.4% |
| Immigrants | Croatia | 97.6 /100 | #94 | Exceptional 62.3% |
| British | 97.4 /100 | #95 | Exceptional 62.3% |
| Chinese | 97.2 /100 | #96 | Exceptional 62.2% |
| Jordanians | 97.2 /100 | #97 | Exceptional 62.2% |
| Carpatho Rusyns | 97.2 /100 | #98 | Exceptional 62.2% |
| Croatians | 97.1 /100 | #99 | Exceptional 62.2% |
Demographics Similar to Venezuelans by College, 1 year or more
In terms of college, 1 year or more, the demographic groups most similar to Venezuelans are Serbian (61.4%, a difference of 0.030%), Immigrants from Chile (61.4%, a difference of 0.040%), Immigrants from Syria (61.3%, a difference of 0.080%), Immigrants from Jordan (61.4%, a difference of 0.12%), and Alsatian (61.3%, a difference of 0.13%).
| Demographics | Rating | Rank | College, 1 year or more |
| Arabs | 93.9 /100 | #117 | Exceptional 61.6% |
| Immigrants | Brazil | 93.9 /100 | #118 | Exceptional 61.6% |
| Assyrians/Chaldeans/Syriacs | 93.3 /100 | #119 | Exceptional 61.5% |
| Pakistanis | 93.2 /100 | #120 | Exceptional 61.5% |
| Immigrants | Jordan | 92.7 /100 | #121 | Exceptional 61.4% |
| Immigrants | Chile | 92.3 /100 | #122 | Exceptional 61.4% |
| Serbians | 92.2 /100 | #123 | Exceptional 61.4% |
| Venezuelans | 92.1 /100 | #124 | Exceptional 61.3% |
| Immigrants | Syria | 91.6 /100 | #125 | Exceptional 61.3% |
| Alsatians | 91.3 /100 | #126 | Exceptional 61.3% |
| Immigrants | Eastern Africa | 91.1 /100 | #127 | Exceptional 61.2% |
| Immigrants | Italy | 91.1 /100 | #128 | Exceptional 61.2% |
| Ugandans | 90.7 /100 | #129 | Exceptional 61.2% |
| Italians | 89.5 /100 | #130 | Excellent 61.1% |
| Immigrants | Morocco | 89.5 /100 | #131 | Excellent 61.1% |